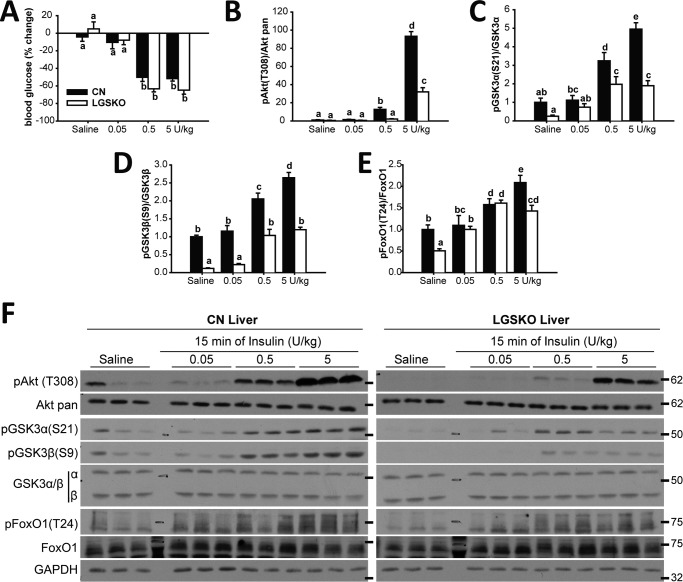
Figure 2.
In vivo response at different insulin amounts is blunted in liver of LGSKO mice. 0.05, 0.5, and 5 units/kg (body weight) of insulin was injected i.p. and then the liver was harvested after 15 min. As control, saline was injected for 15 min (n = 6). A, % of blood glucose difference before and after injection of insulin/vehicle in CN (black bars) and LGSKO mice (white bars). B–E, fold-change compared with CN saline of the phosphorylated form, normalized by total corresponding protein content, of Akt (Thr-308) (B), GSK3α (Ser-21) (C), GSK3β (Ser-9) (D), and FoxO1 (Thr-24) (E). Panel F shows representative blots. The marks on the right represent the molecular weight markers in kDa. Groups with the same letter are not significantly different from each other (p < 0.05).

