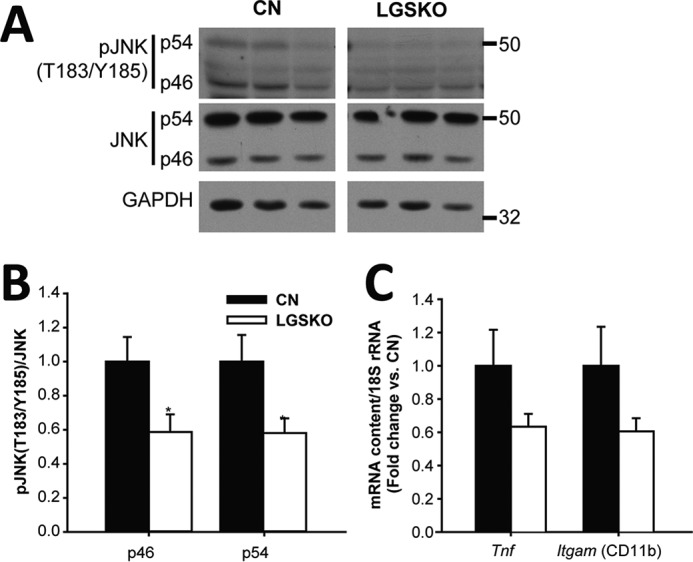
Figure 8.

Inflammatory response in liver of LGSKO mice. Representative blots (A) and fold-change (B) of CN (black bars) and LGSKO (white bars) of pJNK (Thr-183/Tyr-185) p46 and p54 normalized with total JNK in liver (n = 6). C, fold-change of tumor necrosis factor (Tnf) and integrin αM/CD11b (Itgam) mRNA content normalized by 18S rRNA in liver of CN and LGSKO mice measured by quantitative real-time PCR (n = 5). Integrin αM/CD11b amplicon recognizes transcript variants 1 and 2. Marks in the blots are the molecular markers of the noted weight. *, p < 0.05 versus CN by Student's t test.
