
Figure 8.
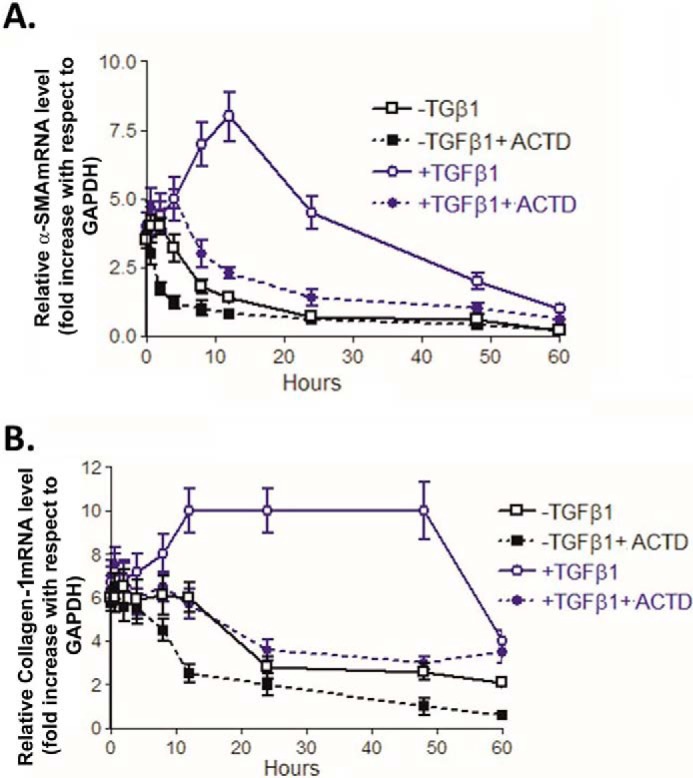
Kinetics of TGFβ1-induced α-Sma and Col1a1 mRNA expression. 21dBLMFbs were serum-deprived for 48 h followed by treatment with or without TGFβ1 (5 ng/ml) for 60 h in the presence or absence of ACTD (2 μg/ml in DMSO). Every 16 h, the serum-free medium was changed to fresh medium, and the ACTD and TGFβ1 addition was continued. RNA was isolated from the cultures at the indicated times after the addition of ACTD. A, time course for real-time PCR analyses for α-Sma mRNA. B, time course for real-time PCR analyses for Col1a1 mRNA. Positive and negative controls are used in the same manner as in Fig. 7 (data not shown). α-SMA and Col1a1 mRNA were normalized against Gapdh and expressed as relative mRNA levels compared with serum-starved MNLFbs. Data are expressed as means ± S.E. (error bars) (n = 3).