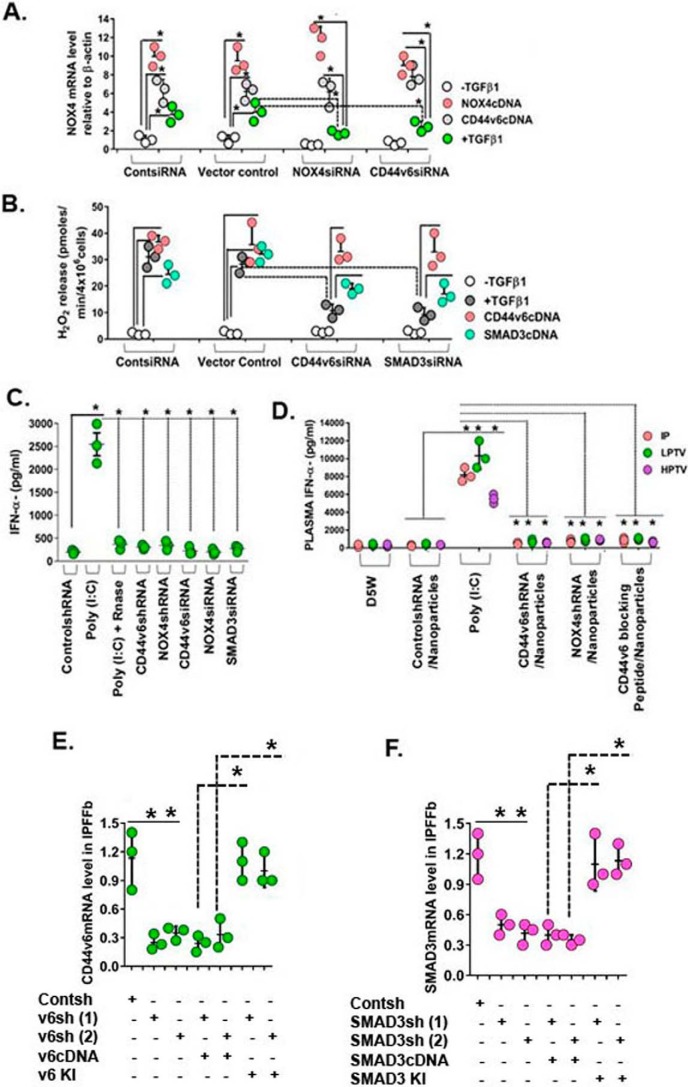
Figure 2.
Confirming the specificity of siRNA and shRNA experiments. A, IPF fibroblasts expressing control siRNA, NOX4 siRNA, or CD44V6 siRNA were further transfected with NOX4 cDNA or CD44V6 cDNA or treated with or without 2.5 ng/ml TGFβ1 for 12 h to induce NOX4 mRNA expression. Total RNAs were examined by real-time PCR analysis for NOX4 mRNA expressed relative to β-actin (A, *, p ≤ 0.005 versus control siRNA-transfected group). B, IPFFbs expressing control siRNA, CD44V6 siRNA, or SMAD3 siRNA were further transfected with CD44V6 cDNA or SMAD3 cDNA or treated with or without 2.5 ng/ml TGFβ1 for 48 h to induce extracellular release of H2O2. The averages of three replicate fibroblast cultures are presented, and error bars represent S.D.; *, p ≤ 0.005. C, plasma IFN-α induction levels in female C57BL mice are shown. 2.5 mg/kg (unless otherwise indicated) of nucleic acid was injected through the tail vein by high pressure (10% (v/w)), and plasma was collected 2 h after injection. The averages of three replicate mice are presented, and error bars represent S.D.; *, p ≤ 0.005. D, effects of administration of D5W (5% (w/v) glucose in water), control shRNA/nanoparticle, poly(I:C), CD44V6 shRNA/nanoparticle, NOX4 shRNA/nanoparticle, or V6-PEP/nanoparticle are shown. Mice received 2.5 mg/kg nucleic acid either intraperitoneally (IP) or through the tail vein via LPTV (1% (v/w)) or HPTV (10% (v/w)). The averages of three replicate mice are presented, and error bars represent S.D.; *, p ≤ 0.005. E and F, the shRNA experiments were corroborated with a knockdown or with a rescue experiment. We verified the blocking of CD44V6 or SMAD3 by specific shRNAs for the CDS, by co-transfecting the shRNA for the target gene with or without corresponding cDNA transfection, or by replacing the knocked down gene(s) (i.e. a gene-replacement strategy, designed to circumvent the shRNA knockdown); this is accomplished by indicated shRNA-mediated knockdown and corresponding KI gene transfection (see Table 1, Fig. 12 (A–F), and the legend to Fig. 12 in our companion paper (71)). Total mRNAs were examined by real-time PCR analysis and expressed relative to β-actin. The averages of three replicate mice are presented, and error bars represent S.D.; *, p ≤ 0.005.

