Figure 7.
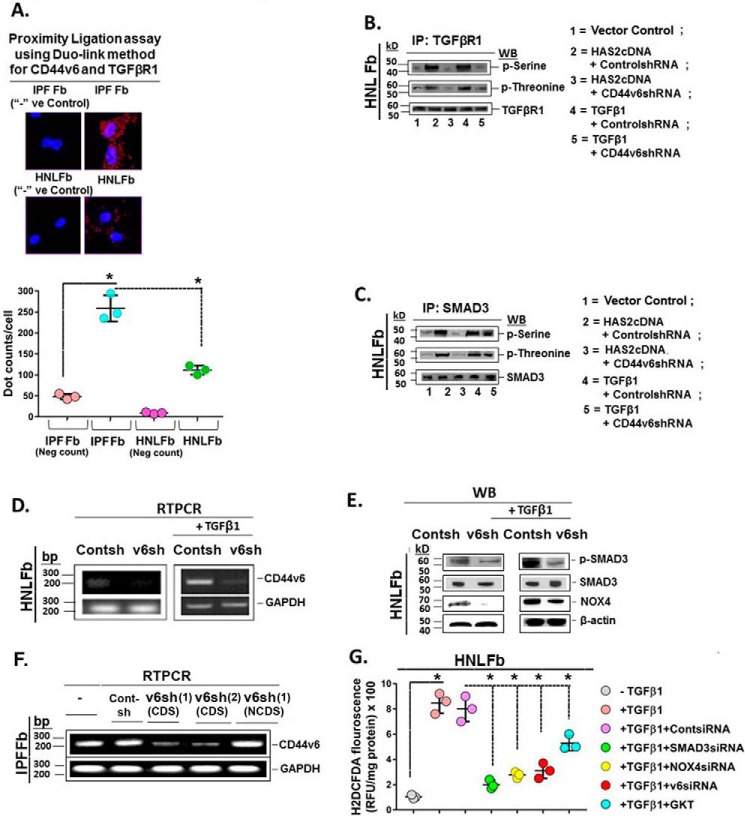
CD44V6/TGFβRI kinase and signaling events in lung fibrosis. A, Duolink assays were performed in IPFFbs and HNLFbs to analyze the association between TGFβRI and CD44v6. Data in A (bottom) are expressed in relative fluorescence units adjusted for protein concentration (mean ± S.E. (error bars); n = 3; *, p ≤ 0.005). B, HNLFbs were transfected with vector control, HAS2 cDNA, or TGFβ1 cDNA or pretransfected with control shRNA or CD44V6 shRNA either alone or followed by HAS2 or TGFβ1 overexpression. After 72 h, lysates were prepared and immunoprecipitated (IP) with anti-TGFβRI antibody. The components in the immunoprecipitate were separated by SDS-PAGE and analyzed by Western blotting with anti-phosphoserine, anti-phosphothreonine, and anti-TGFβRI antibodies. C, the lysates were immunoprecipitated with anti-Smad3 antibody, separated by SDS-PAGE, and analyzed by Western blotting with anti-phosphoserine, anti-phosphothreonine, and anti-Smad3 antibodies. D, real-time PCR analyses are shown for CD44v6 in HNLFbs transfected with control shRNA or CD44V6 shRNA, followed by incubation without (left) or with TGFβ1 for 24 h (right). β-Actin was used as a loading control. E, Western blots are shown for Smad3 phosphorylation, NOX4, and β-actin in lysates from cells harvested from the experiment in C. F, IPFFbs expressing control shRNA or two different V6 shRNAs (V6 shRNA (lane 1) (CDS) or V6 shRNA (lane 2) (CDS)) or V6 shRNA (lane 1) (NCDS). Total RNAs were examined by real-time PCR analysis for CD44V6 mRNA expressed relative to GAPDH. G, HNLFbs were treated without or with control siRNA, SMAD3 siRNA, NOX4 siRNA, or CD44V6 siRNA (v6) for 24 h and then treated with TGFβ1 for 12 h. For comparison, HNLFbs were pretreated with 1 μm GKT137831 (GKT; a NOX1/NOX4 inhibitor) alone for 8 h and then treated with TGFβ1 for 12 h. Intracellular ROS generation was detected by measuring H2DCFDA fluorescence. C–F show data representative of three experiments. The experimental data in B and G are from three sets of three independent experiments. Statistical analysis was with ANOVA; B and G, *, p ≤ 0.005 versus the respective control group.

