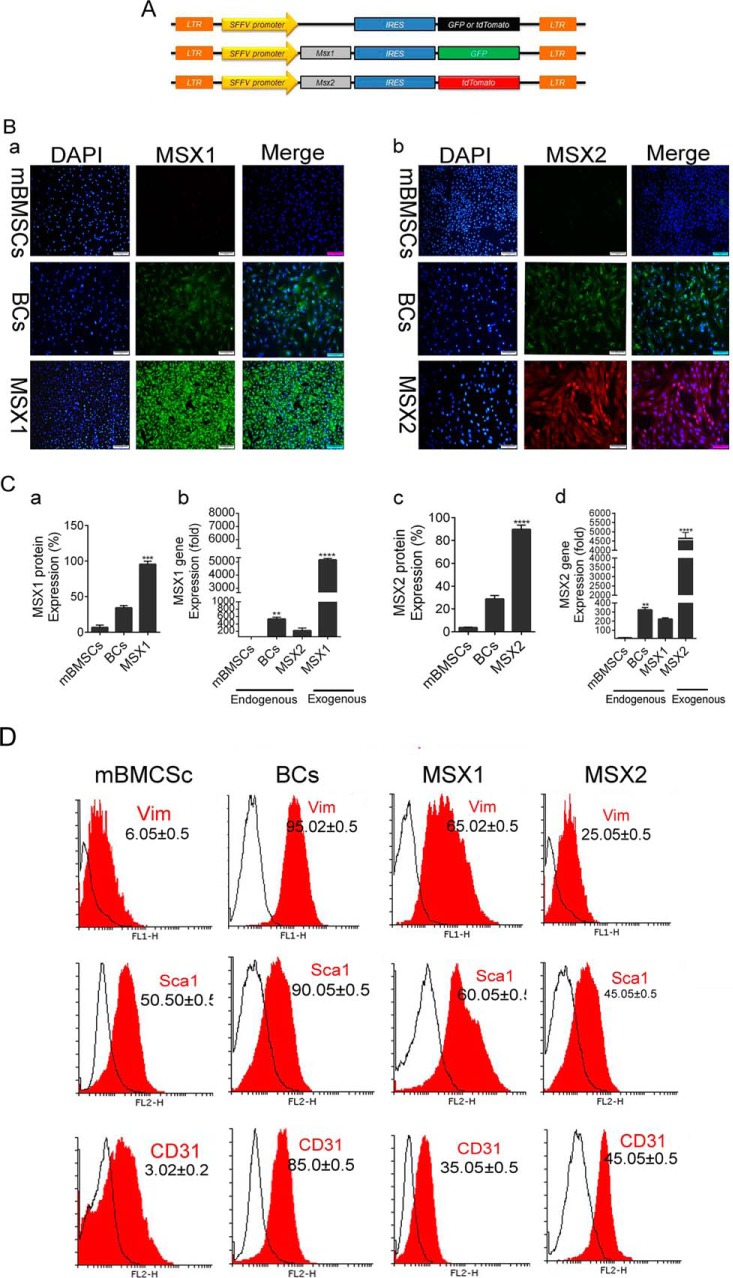
Figure 1.
Msx1 and Msx2 gene transduction in mBMSCs. A, vector map. Msx1 and Msx2 were co-expressed by GFP and tdTomato, respectively, to follow Msx-positive cells in the same vectors. B, the ICC images represent Msx1 and Msx2 genes endogenously expressed in mBMSCs and BCs, as well as exogenous Msx1 (GFP+) and Msx2 (tdTomato+) gene expressions in BlCs cells (a and b). C, real-time PCR analysis shows the gene expression level of Msx1 (b) and Msx2 (d) in BC, mBMSC, and BlC groups. The histograms represent the percentage of Msx1 and Msx2 protein expression levels in BC, mBMSC, and BlC groups (a and c). D, flow cytometry analysis of CD31, Sca1, and Vim cell-surface markers for BlCs, BCs, and mBMSCs. Scale bar, 50 μm. Data are presented as means ± S.D. (error bars). ****, p < 0.0001.

