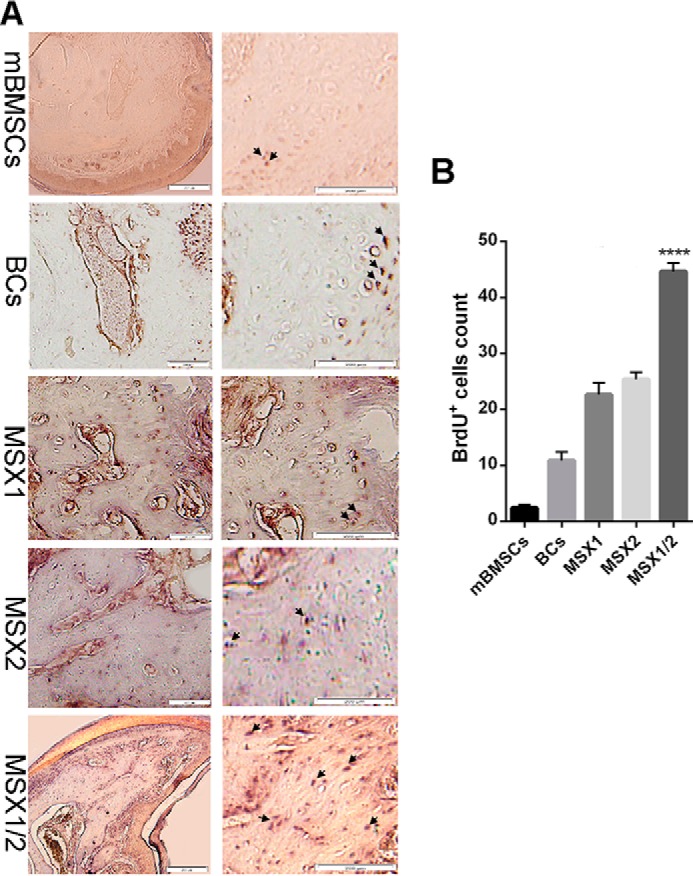
Figure 6.

Tracking of BrdU-labeled cells after 6 WPI. A, immunohistochemistry illustrates BrdU-labeled cells in mBMSC, BC, MSX1, MSX2 and MSX1/2 groups. B, the histogram shows quantitative analysis of BrdU+ cell percentage in bone regenerated regions by ImageJ software in all groups (n = 3). The arrows show the positions of labeled cells. Error bars, S.D.
