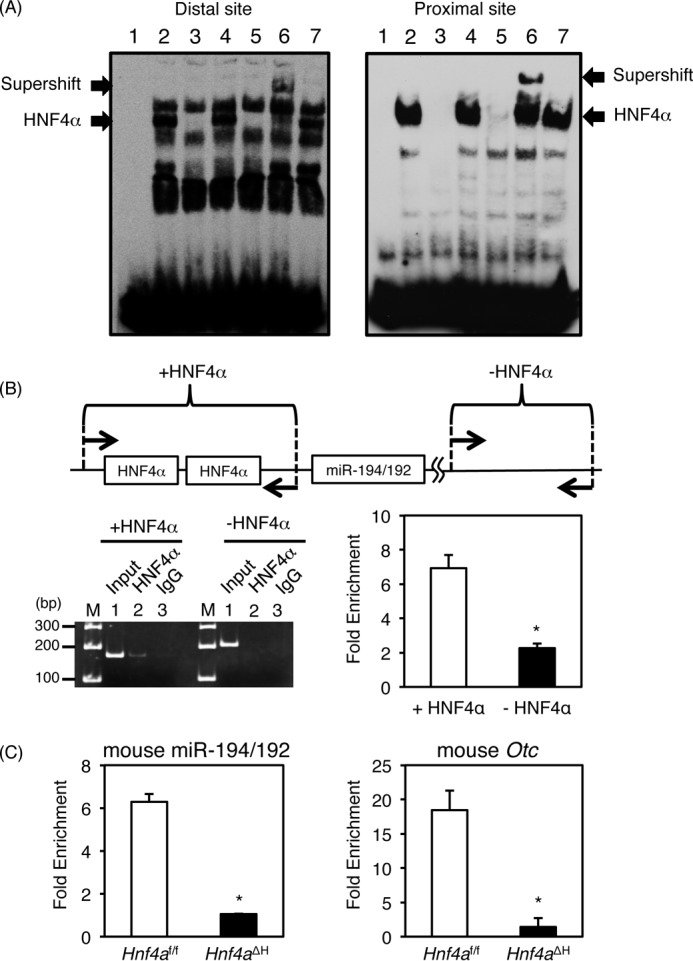
Figure 4.

Identification of HNF4α-binding sites in the miR-194/192 promoter. A, gel shift analysis. Nuclear extracts from HepG2 cells were incubated with biotin-labeled probe carrying the distal (left lane) and proximal (right lane) HNF4α-binding sites in the miR-194/192 promoter in the absence (lane 2) or presence of a 50-fold excess of the unlabeled miR-194/192 probe (lane 3), the mutated miR-194/192 probe (lane 4), and the OTC probe (lane 5). For supershift analysis, anti-HNF4α and anti-C/EBPα antibodies were added (lanes 6 and 7). The complex between HNF4α and the probe and the supershifted complex are indicated by the lower and upper arrows, respectively. B, chromatin immunoprecipitation using HepG2 cells was performed with anti-HNF4α antibody (lane 2) and normal goat IgG (lane 3) (left). Input DNA was used as a positive control (lane 1). The regions between −201 and −41 containing both HNF4α-binding sites (+HNF4α) and between +16667 and +16874 without HNF4α-binding site (−HNF4α) in the human miR-194/192 gene were amplified. The data from qPCR were normalized relative to the input and expressed as -fold enrichment (right). C, chromatin immunoprecipitation using the livers of Hnf4aΔH and Hnf4af/f mice with anti-HNF4α antibody and normal goat IgG. The regions between −164 and −70 containing both HNF4α-binding sites in the mouse miR-194/192 promoter (left), between −264 and −165 containing two HNF4α-binding sites in the mouse Otc promoter (right), and between +45820 and +45893 without an HNF4α-binding site in the mouse Hmgcs2 gene were amplified, respectively. The data from qPCR was normalized relative to the input and expressed as -fold enrichment over data from IgG control. Error bars represent S.D. Data are mean ± S.D. of three independent experiments. *, p < 0.05.
