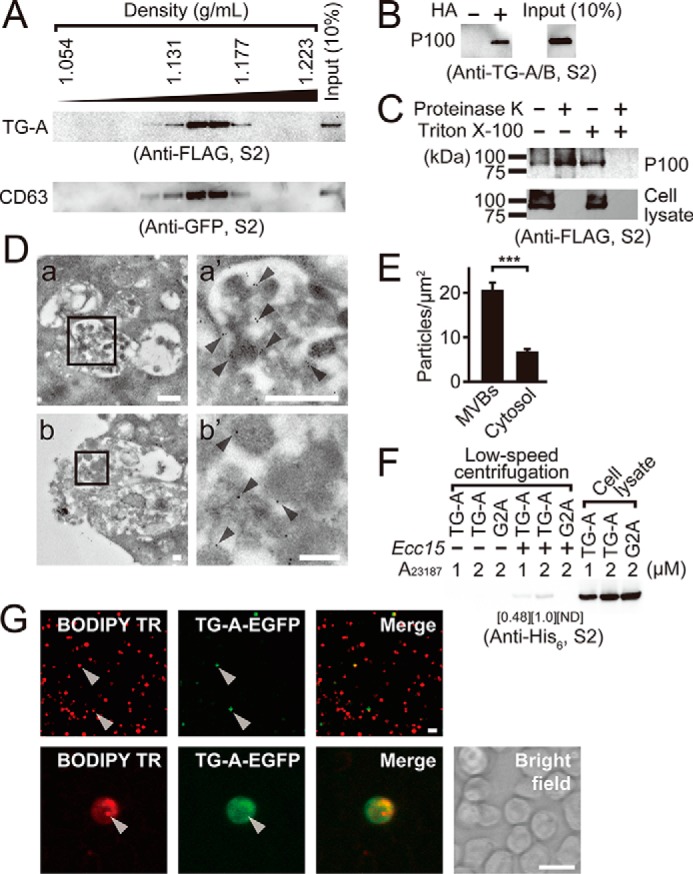
Figure 5.

Profiles of TG-A containing exosomes. A, the P100 fraction prepared from A23187-stimulated the C-terminal FLAG tagged-TG-A- and the N-terminal EGFP-tagged-CD63-expressing S2 cells was analyzed by density gradient centrifugation using OptiPrep. B and C, the P100 fraction from A23187-stimulated the C-terminal FLAG tagged-TG-A-expressing S2 cells was analyzed by the biotin-switch assay with or without HA (B), or treated with or without 10 μm proteinase K in the presence or absence of 1% Triton X-100 for 1 h at 37 °C (C). D, immunotransmission electron microscopic analysis of S2 cells expressing the C-terminal FLAG-tagged TG-A. The TG-A-specific antibody was used as a primary antibody and was detected by the anti-rabbit colloidal-gold conjugated secondary antibody. a′ and b′ represent magnified photographs of square area of a and b, respectively. Arrowheads indicate 10-nm colloidal gold signals. The scale bars in white in a and b, or a′ and b′ are 500 and 100 nm, respectively. E, intracellular gold particles from 10 cells in the immune transmission electron microscopic analysis were counted and analyzed by Student's t test. ***, p < 0.001. Error bars indicate ± S.E. (n = 10). F, the P100 fraction prepared from A23187-treated (1 or 2 μm) the C-terminal V5-His6-tagged TG-A-expressing S2 cells were incubated with Ecc15 for 1 h at room temperature. After incubation, bacteria were collected and washed three times, and then bacteria-bound proteins were analyzed by Western blotting using the anti-His6 tag antibody. Numbers show the band intensity of the bacteria-bound fraction analyzed by ImageJ software, and the intensity at the 2 μm A23187 was set to 1.0. ND, not detectable. G, S2 cells expressing the C-terminal EGFP tagged-TG-A were labeled with the exosomal marker BODIPY TR ceramide, and stimulated with A23187, and then the resulting P100 fraction was collected and added to untransfected S2 cells for 1 h. The exosome-treated S2 cells were analyzed under a fluorescence microscope. The scale bars in white are 10 μm.
