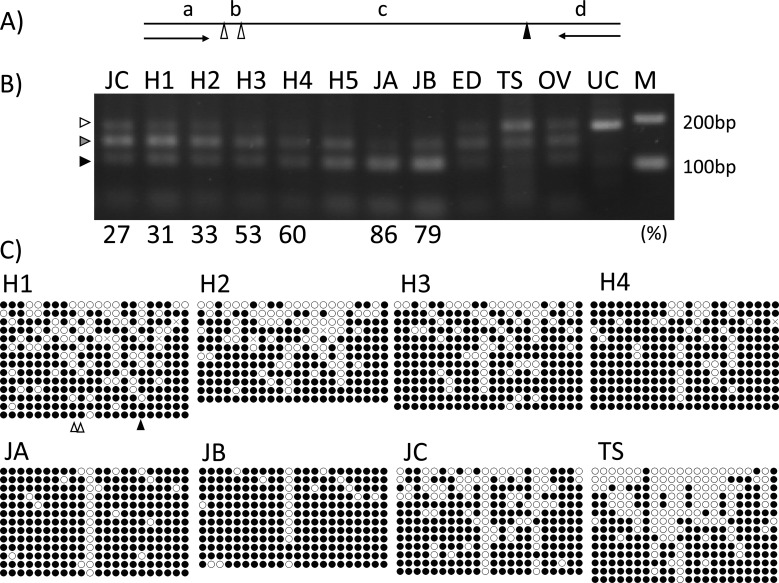
Fig. 3.
Age-related and individual differences in methylation levels of CpG1 revealed by COBRA and bisulfite sequencing. (A) Positions of the restriction enzyme TaqI of the PCR product (181 bp) amplified by CpG1 primers (arrows) for COBRA. Three methylated CpG sites indicated by triangles, including CpG1 (indicated by a black triangle), were digested by TaqI. The DNA bands, 151 bp (b + c + d), 142 bp (a + b + c), 140 bp (c + d), 112 bp (b + c), 101 bp (c), 41 bp (a + b), 39 bp (d), 30 bp (a), and 11 bp (b) can be obtained by TaqI digestion. (B) The percentage indicated below the gels are the CpG1 methylation levels measured using a human microarray. H1–H4, JA, JB, JC: spermatozoa; H5: spermatozoa in the semen samples collected from the same Holstein bull at the age of 35 months; ED: epididymis; TS: testis; OV: ovary; UC: un-cut by restriction enzyme; M: 100-bp ladder DNA size marker. DNA bands dependent on the methylated patterns were visualized at 181 bp (0% methylated, indicated by a white arrow), 140–151 bp (indicated by a gray arrow), 101–112 bp (indicated by a black arrow), and a small band at 11–41 bp on the gel. (C) The data for each methylation level are shown in Table 4. The location of CpG1 is indicated by a black triangle and the other locations of restriction enzyme sites (TaqI) are indicated by white triangles below the panel H1.

