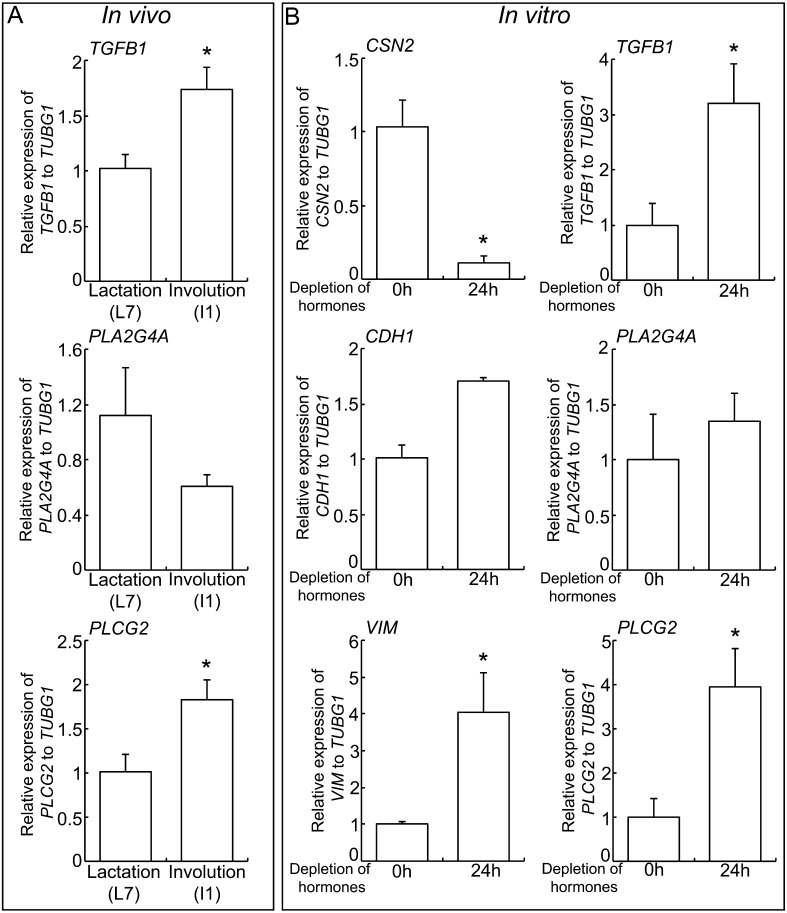
Fig. 2.
TGFβ1 and arachidonic acid synthesis genes expression in mammary gland involution. (A) Real-time PCR of TGFB1, PLA2G4A and PLCG2 in mouse mammary gland at L7 and I1. Bars represent means ± SEM for four independent experiments. Asterisk indicates significant differences (P < 0.05). (B) Real-time PCR of CSN2, CDH1, VIM, TGFB1, PLA2G4A and PLCG2 in Eph4 cells incubated in lactogenic hormones-depleted medium for 1 day. Bars represent means ± SEM for four independent experiments. Asterisk indicates significant differences (P < 0.05).

