
Figure 3.
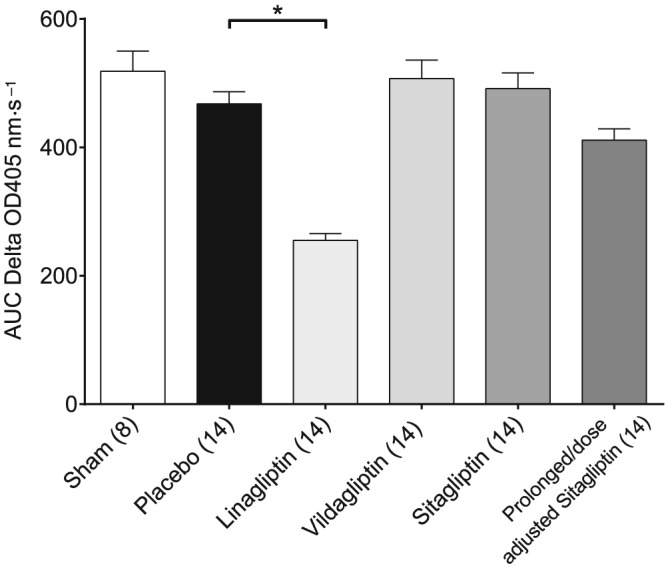
Renal DPP4 activity. Mean area AUC was calculated for each treatment group‐specific δ OD 405 nm·s−1 curve, and resulting mean values were analysed. Values shown are means ± SEM. *P < 0.05, significantly different as indicated; one‐way ANOVA.