Figure 3.

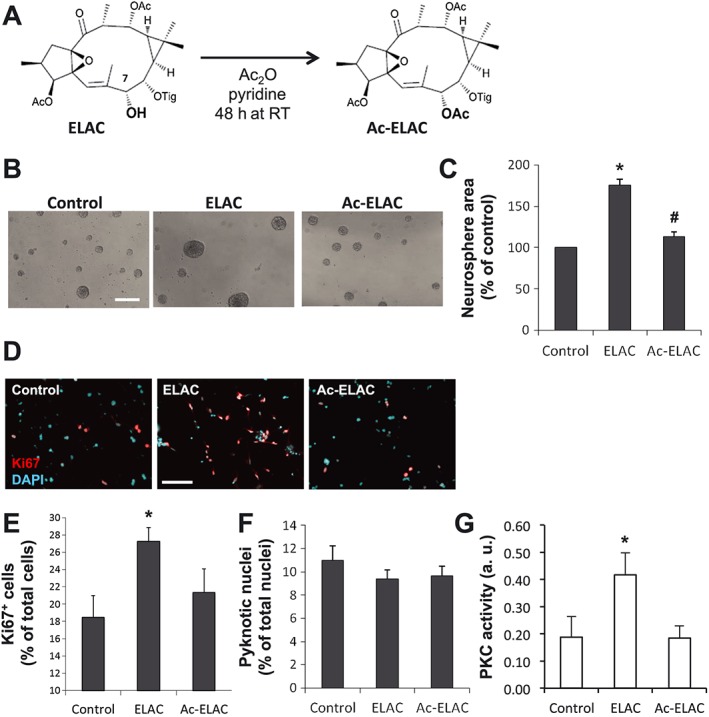
The effect of ELAC on NPC proliferation is lost upon acetylation at the C7‐hydroxyl. (A) Scheme of the acetylation reaction in which ELAC is O‐acetylated at the C7‐hydroxyl group to obtain the product Ac‐ELAC, performed with acetic anhydride (Ac2O) in pyridine medium for 48 h. (B) Phase‐contrast microphotographs of neurospheres cultured for 72 h in the absence or presence of ELAC (5 μM) or Ac‐ELAC (5 μM). Scale bar indicates 200 μm. (C) Graph shows the effect of ELAC (5 μM) or Ac‐ELAC (5 μM) on neurosphere area after 72 h of culture. A minimum of 540 neurospheres was measured per condition. (D) Fluorescence microphotographs of neurosphere‐derived adhered cells grown for 48 h with or without 5 μM ELAC or 5 μM Ac‐ELAC. Cells were immunostained to detect the proliferation marker Ki67 (red), which labels the nuclei of cells that have not yet withdrawn from the cell‐cycle, and total nuclei were counterstained with DAPI (cyan). Scale bar indicates 100 μm. (E) Quantification of Ki67+ cells in culture preparations as those described in (D); Ki67+ cells are expressed as percentage of total cells. (F) Quantification of pyknotic nuclei in culture preparations as those described in (D), expressed as percentage of total nuclei. In all cases, cells were cultured in the presence of bFGF. (G) PKC activity was measured in lysates obtained from cells that had been treated for 1 h with 5 μM ELAC, 5 μM AC‐ELAC, or none, using a PKC activity assay kit. PKC activation induced by ELAC was equivalent to the kinase activity observed in the positive control (consisting of 60 ng of purified active PKC), and no PKC activity was induced by AC‐ELAC. Results are the mean ± SEM of five independent experiments, and each individual experiment was performed in triplicates. *P < 0.05 when compared with control in a Student's t‐test; #P < 0.05 when compared with ELAC in a Student's t‐test. Abbreviations: Ac, acetyl; Tig, tigloyl.
