Figure 5.

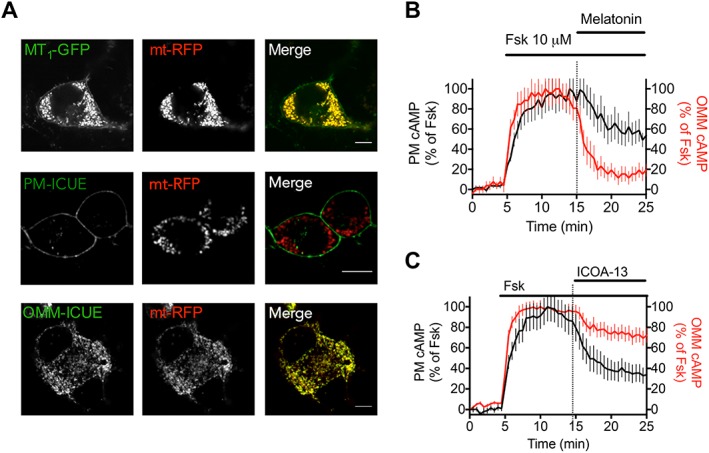
Mitochondrial MT1 receptor signalling and localization. (A) Confocal imaging of N2a cells expressing MT1‐GFP or the FRET‐based cAMP sensors that localized either at the plasma membrane (PM‐ICUE) or the outer mitochondrial membrane (OMM‐ICUE) (green) together with the mitochondrial marker mt‐RFP (red). Scale bar, 10 μm. (B, C) Averaged time courses of forskolin‐mediated (10 μM) cAMP production in N2a cells expressing MT1 receptors and the FRET‐based cAMP biosensors localized either at the plasma membrane (PM) or the outer mitochondrial membrane (OMM) and challenged by melatonin (100 nM) (B) and ICOA‐13 (1 uM) (C). Data are expressed as the mean value ± SD, from n = 19 (MT, PM), n = 34 (MT, OMM), n = 24 (ICOA13, PM) and n = 41 (ICOA13, OMM).
