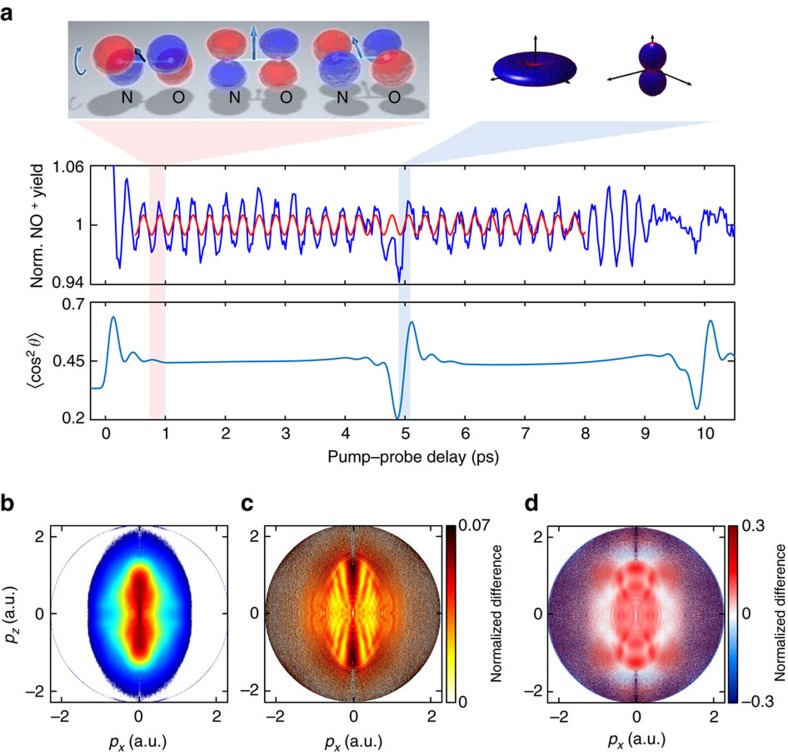
Figure 1. Discerning electronic and nuclear dynamics.
(a) The top panel illustrates the prepared electronic and rotational dynamics with the left part showing the time-evolution of the one-electron wave function in NO and the right part illustrating the molecular-axis distribution. The wave function can be chosen real-valued with opposite signs (red and blue) by multiplication with a global phase factor that corresponds to a physically irrelevant shift of the absolute energy scale. The middle panel shows the time-dependent normalized NO+ yield (blue line) and a sine function with a period of 277 fs (red line). The lowest panel shows the calculated alignment dynamics expressed by 〈cos2θ〉 (including volume averaging). (b) Photoelectron momentum distribution of excited NO molecules recorded at a delay of 1.56 ps. Normalized difference S(t1, t2) (defined in the text) of momentum distributions measured at the minimum and maximum of the NO+ signal dominated by electronic dynamics (c, t1=1.56 ps and t2=1.72 ps, respectively) or around the rotational revival (d, at t1=4.91 ps and t2=5.10 ps, respectively). a.u., atomic units.

