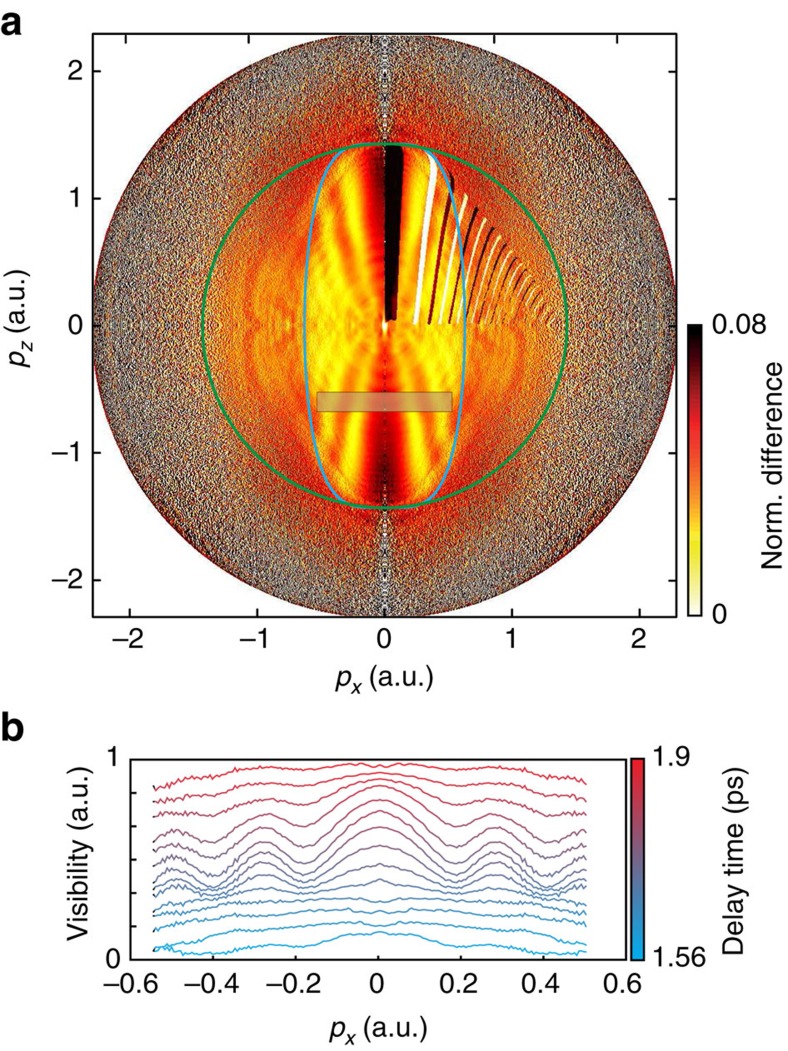
Figure 2. Time-dependent photoelectron holography.
(a) Normalized difference S(t1, t2) between delays t1=1.56 ps and t2=1.72 ps, dominated by electronic dynamics. The added curves are discussed in the text. The polarization of both laser pulses was parallel to the pz axis. (b) Lineouts of the holographic pattern obtained by integrating the signal inside the grey box in a over pz, but recorded at the indicated delays that sample one period of the electronic dynamics and are referenced to a delay of 1.05 ps.

