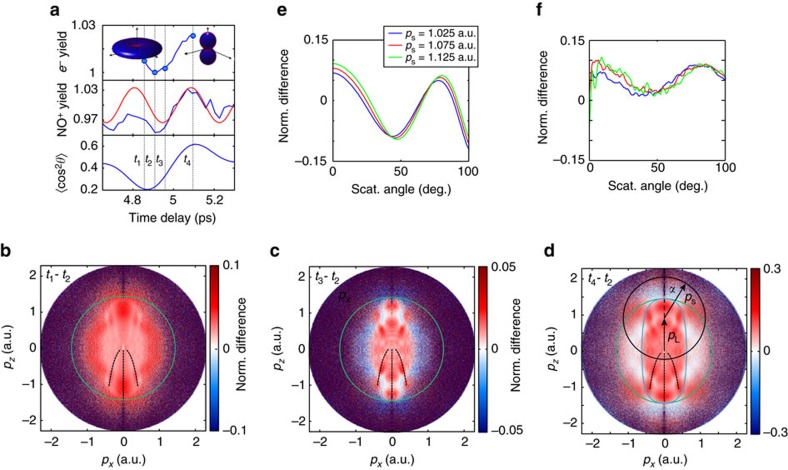
Figure 5. Manifestation of coupled electronic-nuclear dynamics in holography and LIED.
(a) Normalized photoelectron yield integrated over all momenta around the first revival (top), NO+ yield in blue and extrapolated electronic quantum beat in red (middle) and calculated alignment dynamics (bottom). (b) Normalized difference S(t2, t1) for t1=4.86 ps and t2=4.91 ps. The green circle indicates the 2Up limit. The black dashed lines indicate the position of the maximum of the holographic pattern of Fig. 2a. (c) S(t2, t3) for t3=4.96 ps. (d) S(t2, t4) for t4=5.10 ps, the blue line is the same as in Fig. 2a. The black circle indicates the final momentum of photoelectrons with a scattering momentum |ps| and scattering angle α (α=0 corresponds to back-scattering). (e) Calculated normalized difference of rescattered electron distributions for different scattering momenta. (f) Experimental normalized differences as a function of the scattering angle for the same scattering momenta as in e, smoothed over a 10° range, using the same colour coding as in e.

