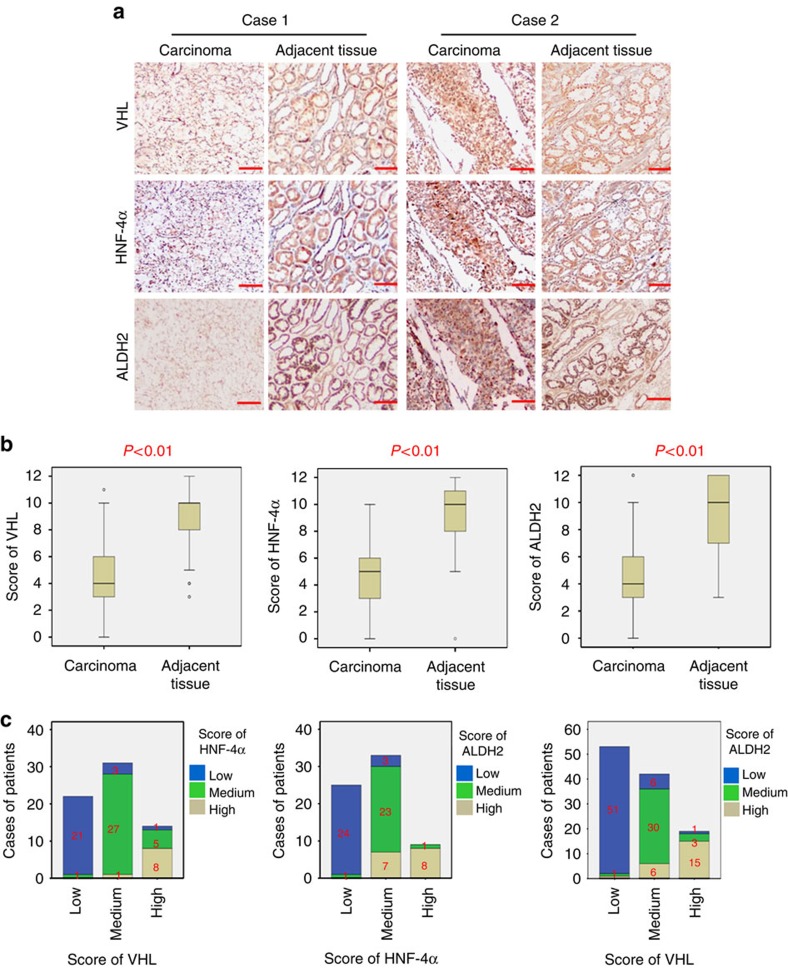
Figure 8. Correlation of these proteins in ccRCC tissues.
(a) Representative immunohistochemistry images of ccRCC samples for the low and high expressions of indicated proteins. The scale bar represents 100 μm. (b) VHL, HNF-4α and ALDH2 expression scores are shown as box plots, with the horizontal lines representing the median; the bottom and top of the boxes representing the 25th and 75th percentiles, respectively; and the vertical bars representing the range of data. We compared renal clear cell carcinoma tissues with matched adjacent tissues (n=114). Any outliers are marked with a circle. P value is calculated via t-test. (c) Correlation analysis of VHL, HNF-4α and ALDH2 expression are calculated via Pearson’s χ2 test and all the P value are less than 0.01.

