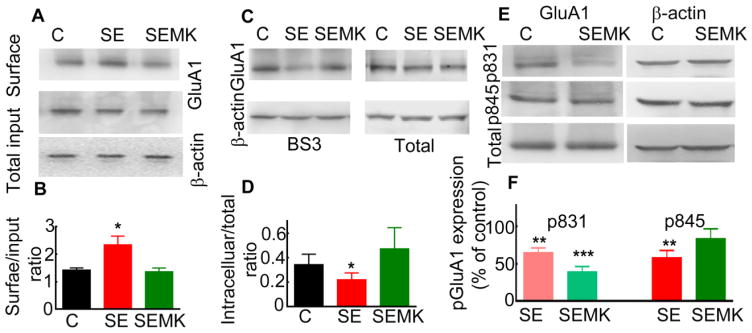
Figure 4. Blocking of NMDAR activation during ESE prevented the increased surface expression of the GluA1 subunit.
MK-801 (2 mg/kg) was administered at 10 min after the first stage 5 behavioral seizure induced by pilocarpine. Control and MK-801-treated or untreated SE animals were processed simultaneously. (A) The surface expression of the GluA1 subunit in the microdissected CA1 region of MK-801-treated or untreated SE and naïve animals. (B) The surface expression of the GluA1 subunit normalized to the input (N=5 each, * p < 0.05, ANOVA with Dunn’s post hoc multiple comparison test). (C) The intracellular expression levels of the GluA1 subunit in the control and MK-801-treated SE animals were comparable. The intracellular GluA1 subunit expression in an untreated 60 min-ESE animal, shown for comparison, was lower. (D) Intracellular to total expression ratio of the GluA1 subunit in control and SE animals treated or untreated with MK-801 (N= 6 each, * p < 0.05, ANOVA with Dunn’s post hoc multiple comparison test). (E) The expression of GluA1 subunit phosphorylated on residues S831 and S845. The expression of β-actin is shown as loading control. (F). The GluA1 pS831 and GluA1 p845 expression in naïve and MK-801-treated SE animals (N= 5 each). The expression of GluA1 phosphorylated on S831 and S845 in animals in SE that did not receive any treatment is shown for comparison (N=5), **p<0.005, and *** p<0.001, Kruskal-Wallis test followed by Dunn’s multiple comparison test.

