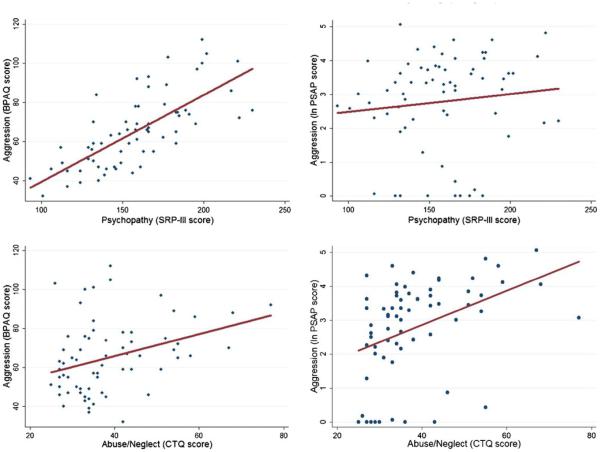
Fig. 1.
The four panels depict the relationship between aggression and a psychopathy and b abuse/neglect. The top two graphs show a scatter plot of aggression scores on the BPAQ and PSAP versus psychopathy along with a linear fit to the data. The bottom two graphs show a scatter plot of aggression scores on the BPAQ and PSAP versus abuse/neglect along with a linear fit to the data

