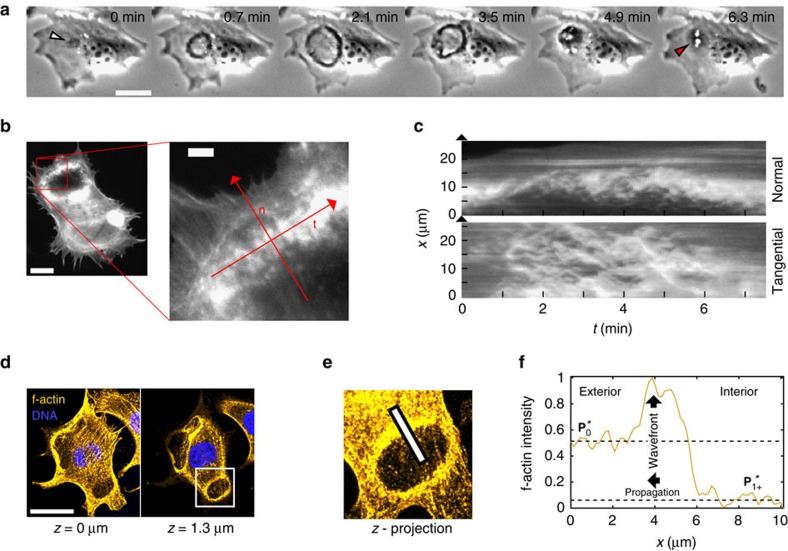
Figure 1. Characteristics of CDRs.
(a) Time-lapse sequence showing the typical course of a spontaneously formed CDR (scale bar: 25 μm). The white arrow indicates the initiation of the CDR and the red arrow the macropinosomes (appearing as white spots) formed on CDR collapse. (b) Living cell stained for f-actin with a close-up view on a CDR wavefront showing its sub-structure of dynamic actin clusters (scale bars: full image 25 μm, close-up 5 μm). (c) Kymographs along red lines in normal (n) and tangential (t) direction to the CDR in b, highlighting the rapid actin turnover within CDR wavefronts. (d) Actin organization of a cell exhibiting two CDRs imaged with confocal fluorescence microscopy in two different z-positions (scale bar: 25 μm). (e) Close-up view of the vertically integrated intensity of the region of interest highlighted with a white rectangle in d. (f) Profile of fluorescence intensity sampled along a cut through the wavefront (white line in (e), length: 10 μm) showing the state of wavefront exterior ( ) and wavefront interior (
 ).
).

