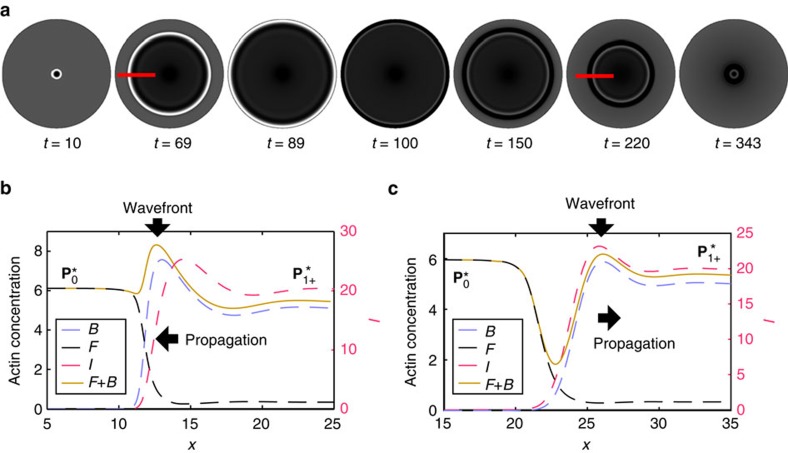
Figure 4. Reproduction of physiological-like CDR dynamics.
(a) Numerical solution of the model showing an expanding wavefront that reverses propagation direction at the boundary and closes back to a point. The results are plotted in terms of the experimental observable F+B. (b and c) Cross sections in normal direction to the expanding/contracting wavefronts at t=69 and t=220, respectively. The peak in the B field corresponds to the wavefront of CDRs. Note the pronounced depletion of F in the area surrounded by the wavefront.

