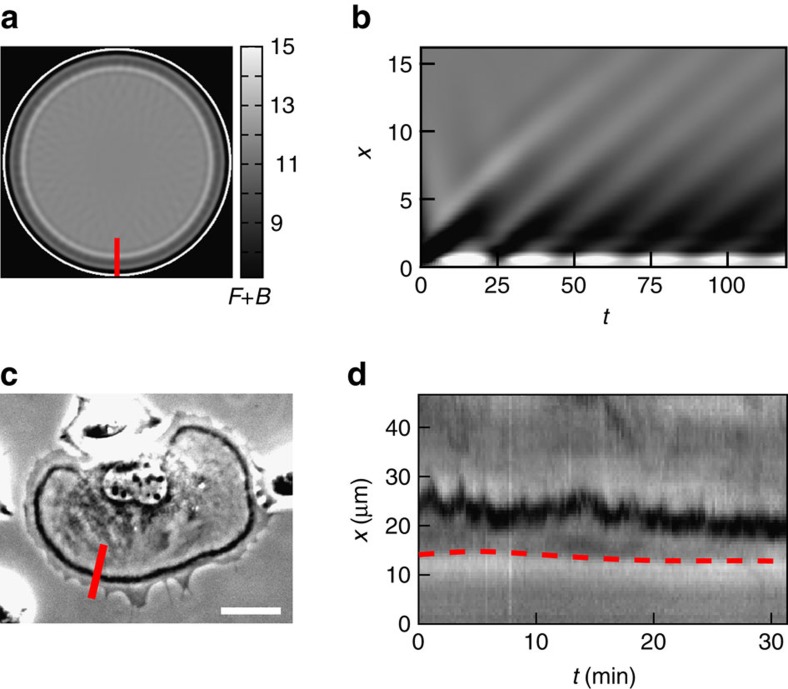
Figure 6. Pinned wavefronts in simulations and experiments.
(a) Pinned wavefront at the edge of the domain as obtained from direct numerical integration of model equations. (b) Space-time plot along red line in a showing fluctuations of the wavefront. Note that the colour map was inverted with respect to previous plots for a better visual comparison to experimental data. (c) Phase contrast image and the respective (d) kymograph showing a typical behaviour of a CDR pinned close to the cell edge (red dashed line). Scale bar: 25 μm.

