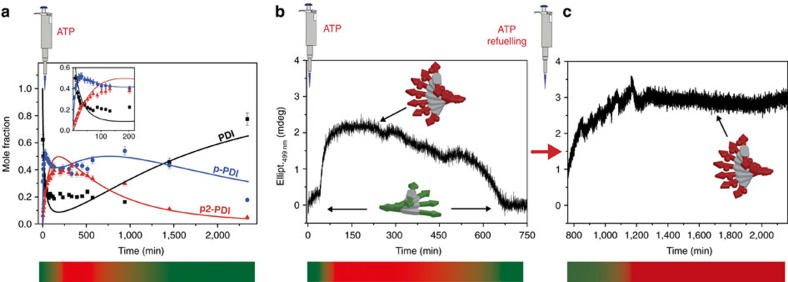
Figure 3. Transient state and refuelling.
(a) Molar fraction of PDI, p-PDI and p2-PDI versus time by LC–MS (points), following the batch addition of ATP (1 mM), PKA (0.13 μM) and λPP (0.3 μM) to a 100 μM PDI solution. The solid lines are the fits of the ODE model. The insert is a zoom at the short times. (b) Time-course CD measurements (monitored at 499 nm, optical path 1 mm) following the batch addition of ATP (2 mM) to a 200 μM PDI solution containing PKA (0.13 μM) and λPP (0.2 μM). The coloured bars at the bottom of a,b indicate the transient formation/disappearance of p2-PDI (red colour) starting from PDI (green colour). (c) Time-course CD measured after refuelling the same solution as in b with a second shot of ATP (2 mM). In this case p2-PDI accumulates.

