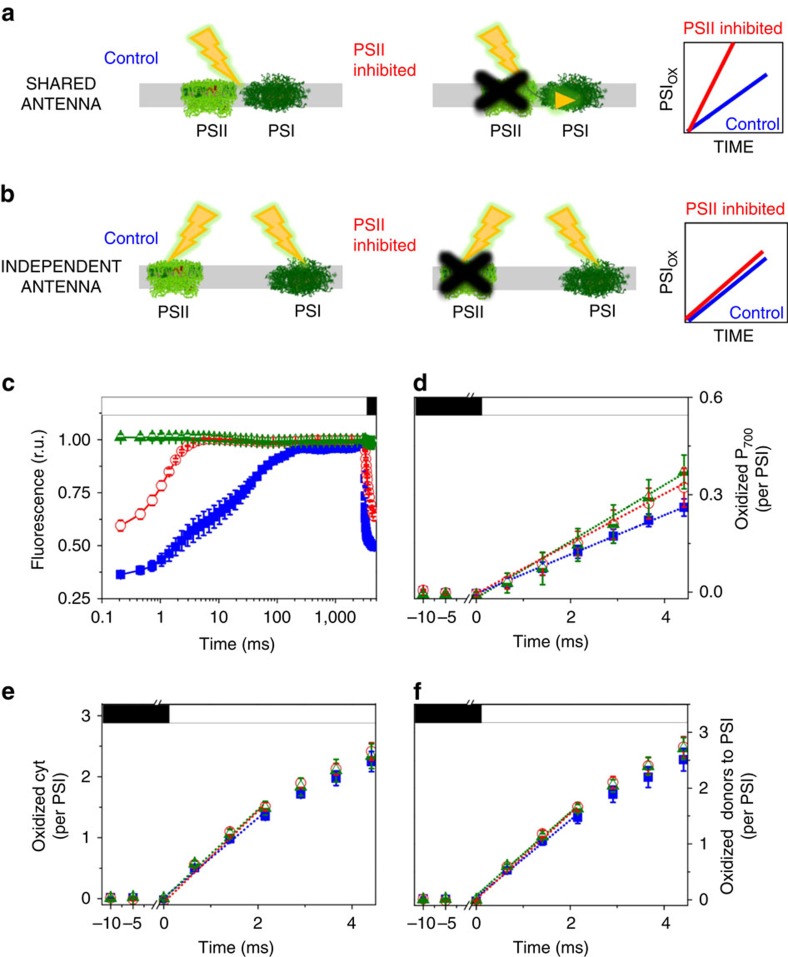
Figure 1. Experimental design used to assess energy spillover in diatoms.
Expected effects of energy spillover from PSII to PSI on PSI activity: physical contact between both PSs (a), disconnected PSs (b). (c) Fluorescence emission kinetics confirm full inhibition of PSII by DCMU and HA. (d) Kinetics of P700 oxidation by light. (e) Kinetics of cyt oxidation by light. (f) Kinetics of oxidation of the entire pool of PSI electron donors by light. A cyt/PSI ratio of 3 was assumed based on the estimate shown in Supplementary Fig. 1. The light intensity was 800 μmol photons m−2 s−1. (c–f) Solid blue squares: control; empty red circles: 40 μM DCMU; green triangles: 40 μM DCMU+2 mM HA. Means±s.e.m. (n=6, from three biological samples). F0: minimum fluorescence emission (active PSII). Fm: maximum fluorescence emission (inactive PSII). Closed box: actinic light off. Open box: actinic light on. DCMU and HA were added immediately before measurements.

