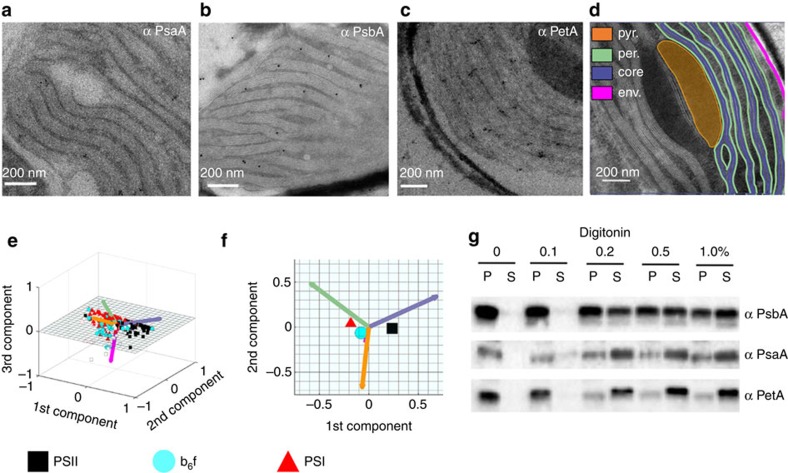
Figure 2. Immunolocalization of photosystems and of cyt b6f in the thylakoid membranes of P. tricornutum.
(a–c) TEM images of P. tricornutum labelled with antibodies directed against the PsaA subunit of PSI (a), the PsbA subunit of PSII (b) and the PetA subunit of cyt b6f (c). (d) TEM micrograph of P. tricornutum thylakoid membranes showing four distinct areas: the internal membranes (‘core’: violet); the external, peripheral membranes (‘per.’: green); the pyrenoid (‘pyr.’: orange) and the envelope (‘env.’: magenta). Bars: 200 nm. (e) Principal component analysis of PSI, cyt b6f and PSII immunolocalization with the PsbA (solid squares), PsbC (open squares), PetA (cyan circle), PsaC (solid triangles) and PsaA (open triangles) antibodies. See also Supplementary Fig. 4. A total of 258 images from four independent cultures were analysed. The first two components represent more than 91% of the variance (see Supplementary Table 1, and Methods for a more detailed explanation). Green arrow: peripheral variable; violet arrow: core variable; orange arrow: pyrenoid variable; Magenta arrow: envelope variable. (f) 2D representation of the barycentre for the PSI (α PsaA+α PsaC antibodies, black square), cyt b6f (PetA, cyan circle) and PSII (α PsbA+α PsbC antibodies, red triangle) distributions. The point size along an axis is proportional to the s.d. along the corresponding component. (g) Solubilization of P. tricornutum thylakoid membranes with increasing concentrations of digitonin (0.1%, 0.2%, 0.5%, 1%). Pellet (P) and supernatant (S) were analysed by western blotting with the same anti PSI, PSII and cyt b6f antibodies as in a–c. Representative data set of an experiment replicated on three different biological samples.

