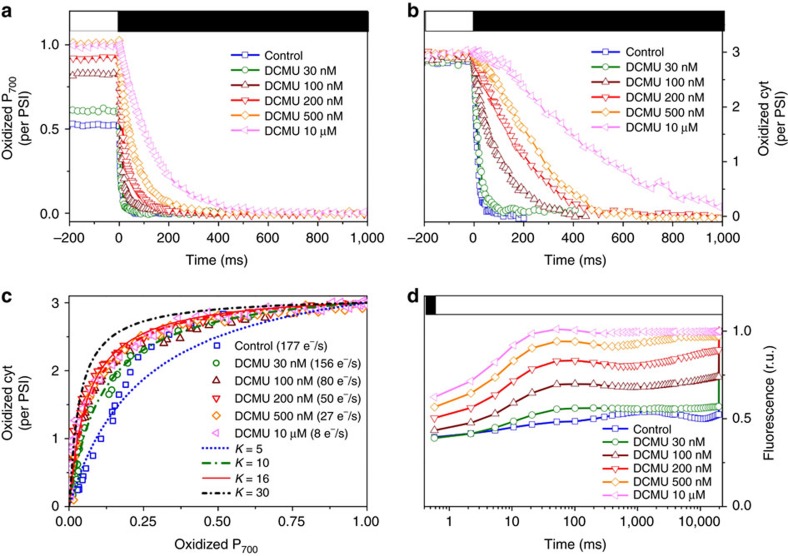
Figure 3. Spectroscopic features of the cytochromes and P700 components of the electron transfer chain in P. tricornutum cells.
(a–b) Redox kinetics of P700 (a) and cyt (b) at the offset of a steady state illumination of 800 μmol photons m−2 s−1 in the absence and in the presence of increasing concentrations of DCMU. Closed box: actinic light off. Open box: actinic light on. (c) Equilibrium plots displaying the percentage of oxidized cyt (from b) as a function of the percentage of oxidized P700 (from a). Every point in c represents a given time after the offset of light in a,b. The dotted lines represent simulations with different values of the equilibrium constant. The rate of electron transfer (calculated as described in Methods) was modified by addition of increasing concentrations of DCMU. (d) Fluorescence induction kinetics measured for every DCMU concentration employed in a,b. The decrease in variable fluorescence indicates the progressive inhibition of PSII by DCMU. Cells were exposed to 18 μmol photons m−2 s−1 because no variable fluorescence can be observed at 800 μmol photons m−2 s−1even in the absence of DCMU (see, for example, Fig. 1c). DCMU was added immediately before measurements. Blue square: control. Green circle: DCMU 30 nM. Wine upwards triangles: DCMU 100 nM. Red downwards triangles: DCMU 200 nM. Orange losange: DCMU 500 nM. Pink leftwards triangle: DCMU 10 μM. Blue dots: simulation with an equilibrium constant of 5. Green dash and dot line: simulation with an equilibrium constant of 10. Red continuous line: simulation with an equilibrium constant of 16. Black short dash dot line: simulation with an equilibrium constant of 30.

