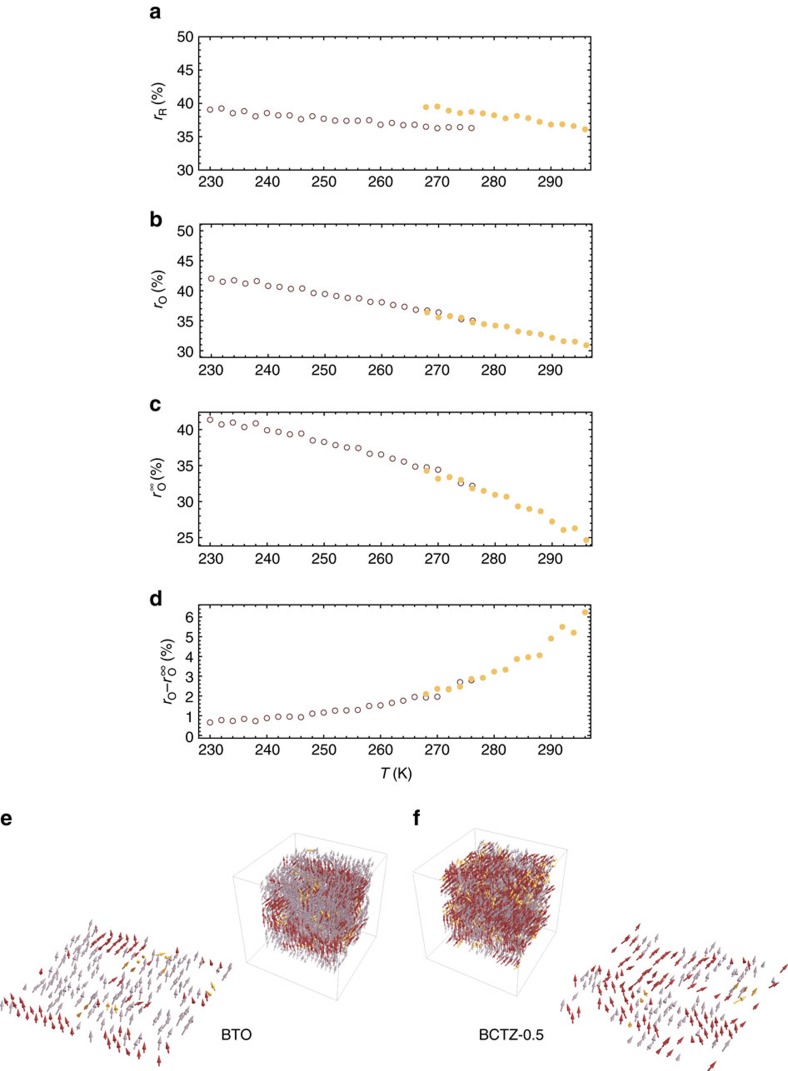
Figure 4. Cluster analysis.
(a,b) Display the percentage occupied by the R and O clusters within the volume of the supercell (rR and rO). (c) Represents the  strength of the percolating O cluster (that is, the infinite cluster that spreads from one side of the supercell to its opposite side along the [100], [010] or [001] pseudo-cubic directions36). (d) Represents the difference between rO and
  . These data (a–d) are shown for BCTZ-0.5 (filled symbols) and BTO (open symbols) in their macroscopic Amm2 state, and correspond to the average over 100 different dipolar configurations (associated with 100 different MC sweeps) at any considered temperature T in a 18 × 18 × 18 supercell. (e,f) Display examples of R clusters (in red) as well as the two types of O clusters (the non-percolating in yellow, and percolating ones in purple) as occurring within the supercell and in a given xy supercell cross-section in BTO at 250 K and in BCTZ-0.5 at 280 K, respectively.

