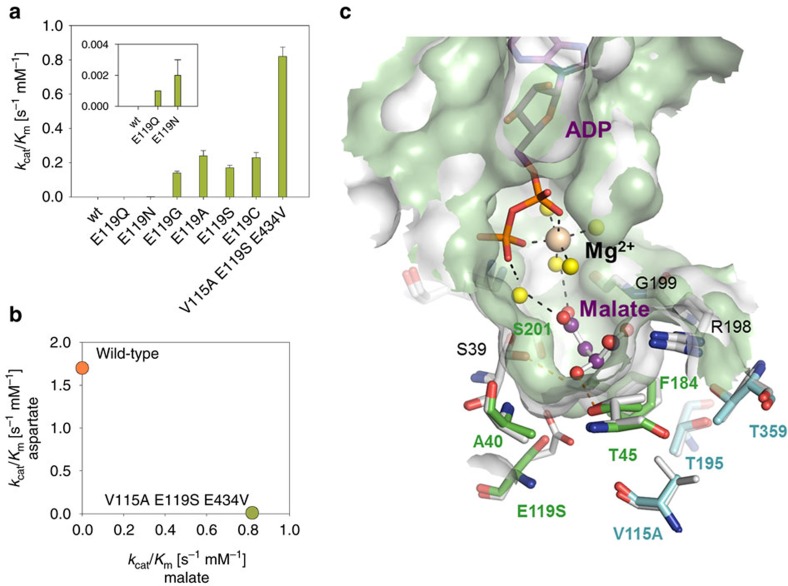
Figure 2. Engineering of malate kinase activity.
(a) Catalytic efficiency (kcat/Km) of wild-type aspartate kinase and the best malate kinase mutants on (L)-aspartate and (L)-malate. Kinetic data are from Supplementary Table 3. The results are the mean of at least two biological replicate experiments. Error bars correspond to the standard deviation of the mean. (b) Catalytic efficiencies (kcat/Km) of wild type LysC and the V115A E119S E434V Lys C triple mutant on (L)-aspartate and (L)-malate. Kinetic data are from Supplementary Table 3. (c) Active-site region in molecular model of complex of the E. coli (Ec-LysC) E119S:V115A double mutant with (L)-malate and Mg-ADP. Carbon atoms in ADP and (L)-malate are coloured in purple. The Mg2+ ion is depicted as an ochre-coloured space filling sphere, and water molecules mediating binding interactions as yellow spheres. Enzyme residue positions in the combinatorial library for experimental screening of malate kinase activity (Supplementary Table 5) are highlighted with green (or cyan) coloured carbon atoms according to whether (or not) direct residue contact can be made with (L)-malate in the model complex. Atoms are otherwise coloured according to element type: other carbon, grey; nitrogen, blue; oxygen, red; and phosphorus, orange. Hydrogen bond interactions are shown as dashed-line vectors connecting donor and acceptor heavy atom positions. The model is overlaid on the X-ray structure of the R-state wild-type enzyme complex with (L)-aspartate and Mg-ADP (PDB code 2j0w) from which it was derived as described in Methods. Diffuse molecular surface representations of the mutant and wild-type enzyme active-sites are respectively shown in green and grey.

