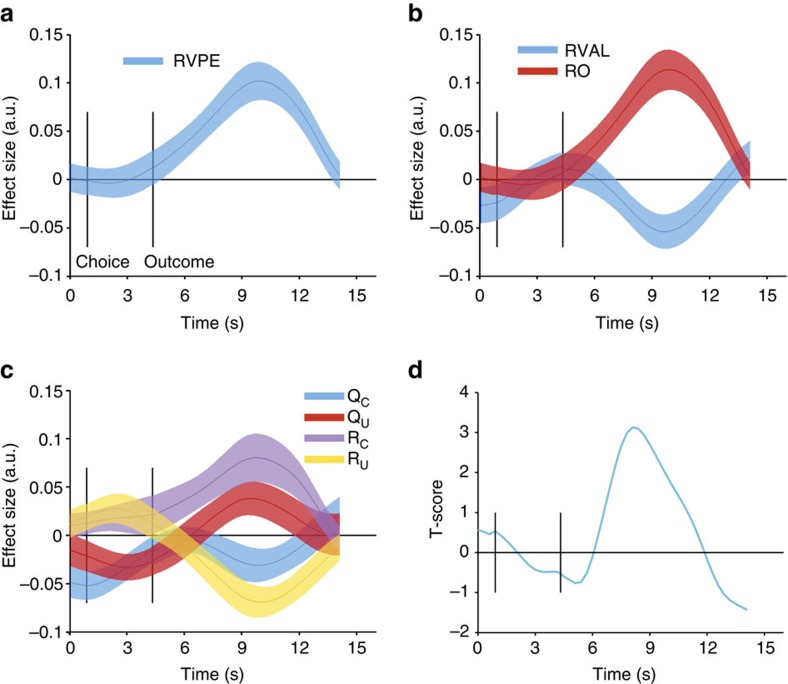
Figure 4. Relative value prediction errors in the striatum.
(a) Following outcome presentation, BOLD signal (interpolated to a resolution of 300 ms) extracted from a striatal region of interest (see methods for details) correlated with the relative value prediction error. (b) The striatal BOLD signal was sensitive to both components of the relative value prediction error, showing the required positive effect of relative outcome (RO) and negative effect of relative value (RVAL). (c) Further decomposition revealed that the signal was sensitive to all component terms of a relative value prediction error: it correlated positively with the chosen outcome, RC and negatively with chosen value, QC—and it correlated negatively with unchosen outcome RU, and positively with unchosen value, QU. Solid lines represent mean, shaded areas s.e.m. of regression coefficients across participants. (d) Relationship between striatal relative value coding and relative value-induced biases. Striatal regression coefficients for relative value, relative outcome and response (not shown in b) were regressed against model fits (negative log likelihoods) of the relative value learner for the first transfer trial. The figure shows the time course of the resulting T-score for relative value. This indicates that subjects that showed pronounced negative coding of relative value after outcome presentation were also strongly guided by relative values on the first transfer trial (low negative log likelihoods).

