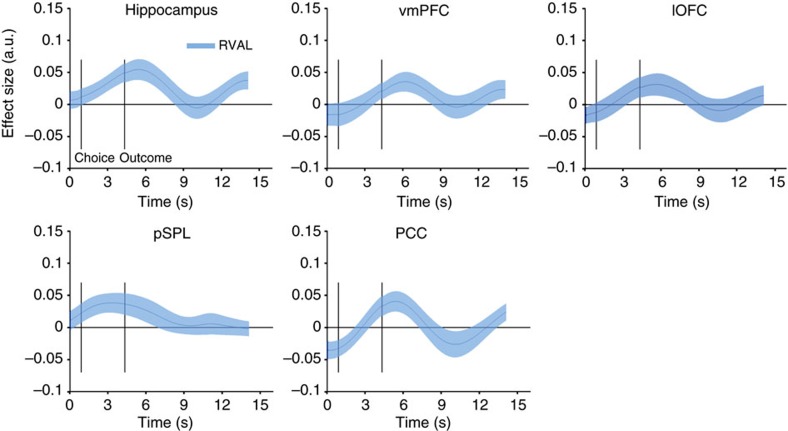
Figure 6. Relative value coding in other brain regions.
A whole-brain contrast (see Fig. 5) revealed several areas that positively coded relative outcome. We extracted BOLD signals (interpolated to a resolution of 300 ms) from these areas to test if any of these was also sensitive to relative value (RVAL), thus being candidates for a region coding relative value prediction errors as shown for the striatum in Fig. 4. Solid lines represent mean, shaded areas s.e.m. of regression coefficients across participants. x- and y axes are the same across all panels.

