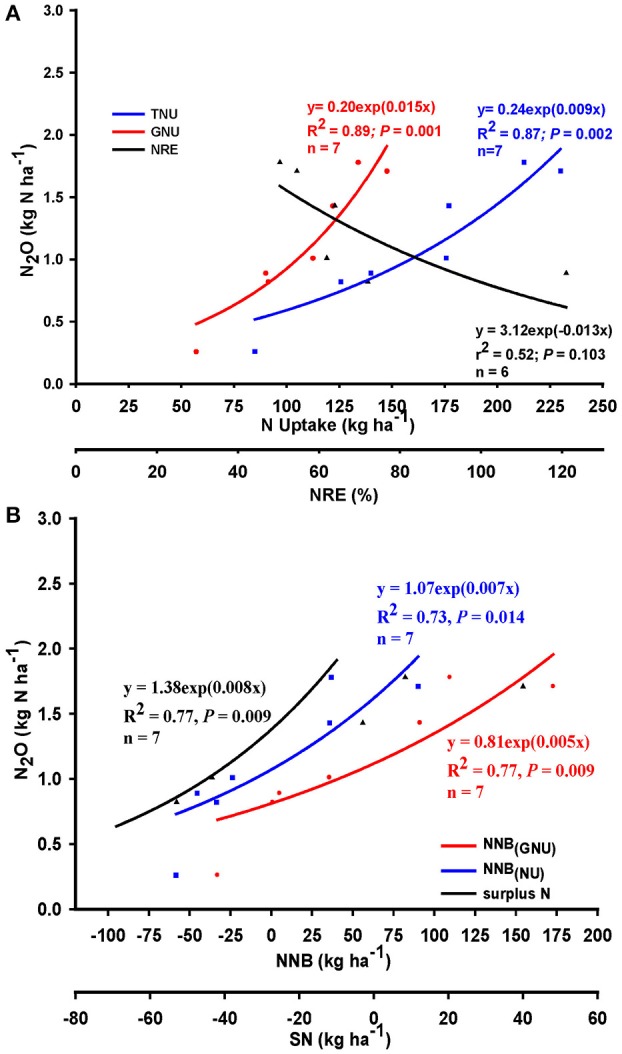
Figure 2.

Relationships between nitrous oxide (N2O) emission and (A) N uptake and recovery efficiency (NRE), (B) net N balance (NNB) relative to TNU, GNU, and SN, when management focused on application rate across Colorado and Indiana (United States), and Quebec and Ontario (Canada) maize production systems; n = number of N rate groups, data points in x-axis represent mean value for the group.
