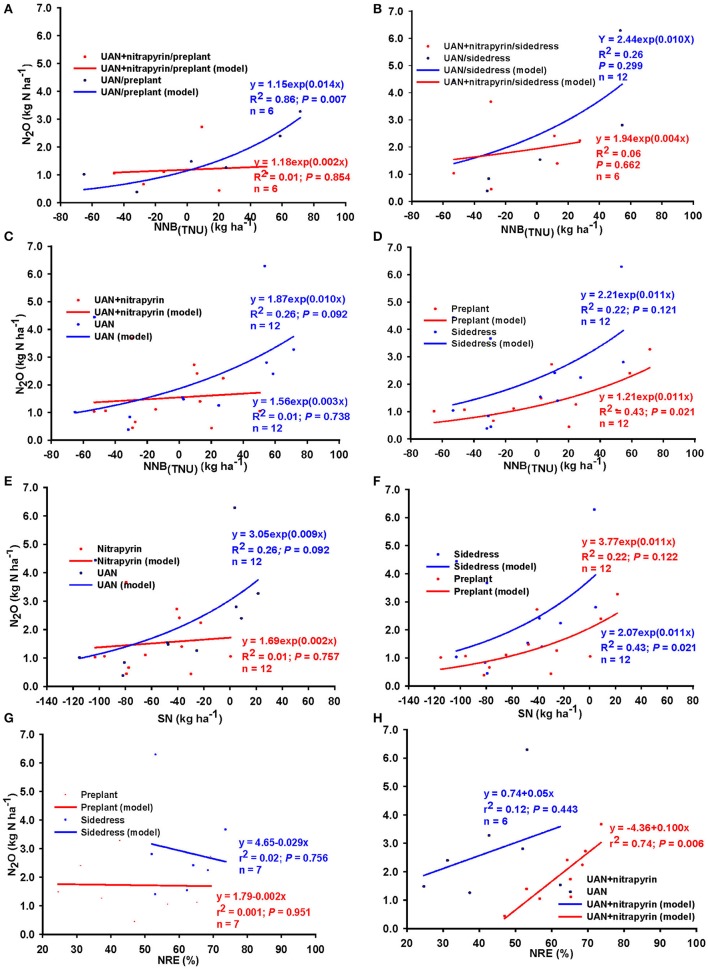
Figure 6.
Relationship between N2O emission and N balance [NNB(TNU)] due to N source and timing combination applied at (A) preplant, (B) sidedress; (C) due to N source averaged over timing, (D) due to timing averaged over source; relationship between N2O and surplus N (E) averaged over timing, (F) averaged over N sources; and relationship between N2O and NRE (G) averaged over N source, and (H) averaged over timing, across Indiana (United States). N = number of observations; for (A,B), n = number of N rate groups and consisted of mean values of 2 observations.

