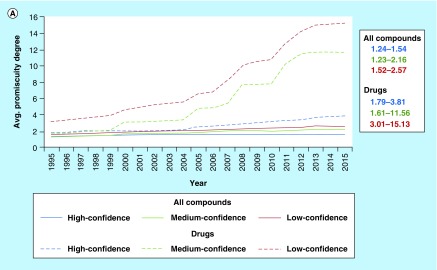
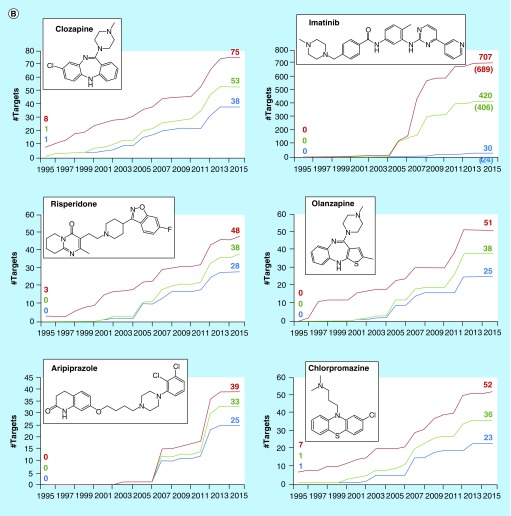
Figure 5. . Progression of compound and drug promiscuity over time.
In (A), the progression of average promiscuity degrees over time is shown for all bioactive compounds (solid lines) and drugs (dashed lines) from the low- (red), medium- (green) and combined high-confidence (blue) datasets of ChEMBL22 and mean PD ranges are reported (right). (B) Shows six drugs from the high-confidence dataset with largest PD increases. For imatinib, the number of target annotations at different confidence levels available in ChEMBL18 [46] is given in parentheses.


