Fig. 7.

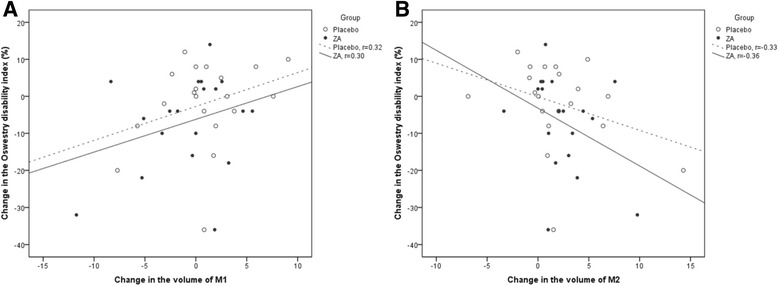
Scatter plots showing a the positive correlation between change in M1 volume and change in the Oswestry Disability Index and b the negative correlation between change in M2 volume and change in the Oswestry Disability Index

Scatter plots showing a the positive correlation between change in M1 volume and change in the Oswestry Disability Index and b the negative correlation between change in M2 volume and change in the Oswestry Disability Index