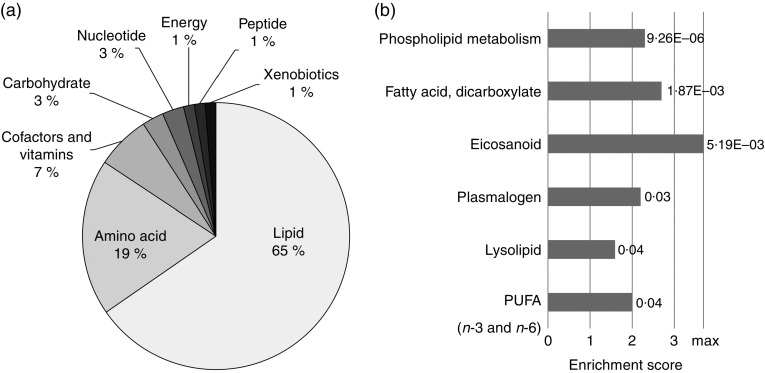
Fig. 2.
Metabolic profiling revealed complex changes in lipid metabolism. (a) Proportional clustering shows statistically different metabolites (n 153, P<0·05) affiliated to their main pathway. (b) Enrichment analysis revealed six significantly enriched sub-pathways. Scores underlie an enrichment of significantly different metabolites of total detected metabolites within a sub-pathway in relation to all significant metabolites to all detected metabolites. Graph shows statistically significant enriched (P<0·05) sub-pathways according to their calculated enrichment scores with indicated P values. The maximum achievable enrichment score is 3·7 (marked with max), if all detected metabolites in a sub-pathway are described as statistical significant different. For all sub-pathway enrichment scores see the online Supplementary Table S4.

