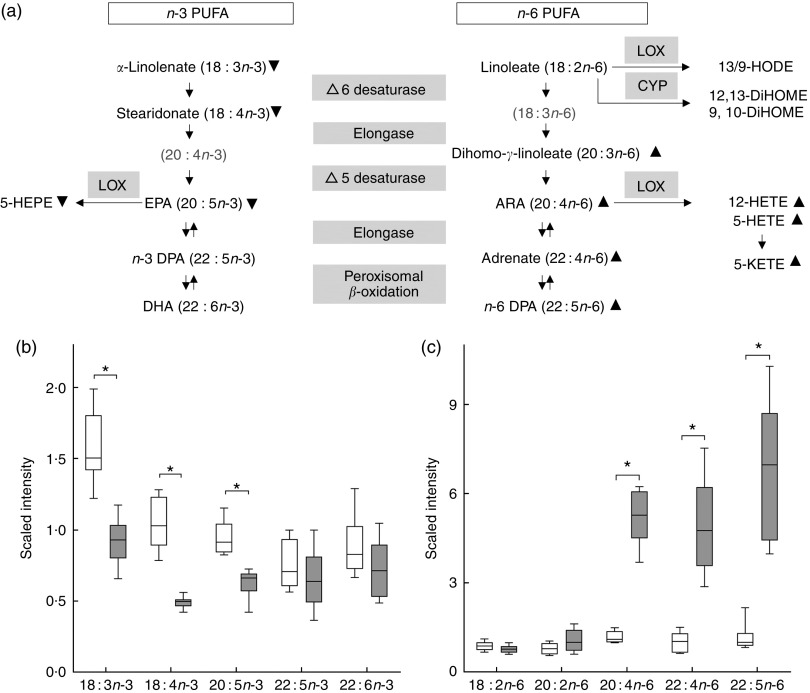
Fig. 3.
Metabolic profiling revealed changes in PUFA synthesis. (a) Metabolites illustrated
in the PUFA synthesis pathway with lipoxygenase (LOX) and cytochrome P450
(CYP)-derived eicosanoid classes.  ,
,  ,
Statistically significant lower and higher metabolite levels in the high-arachidonic
acid (ARA) group compared with the control group. Grey highlighted metabolites were
not detected. (b) and (c) Box plots of normalised data expressed as scaled intensity
of single n-3 and n-6 PUFA, respectively.
 , Control;
  ,
high-ARA; ARA, 20 : 4n-6; DHA, 22 : 6n-3; EPA, 20
: 5 n-3; n-3 DPA, 22 : 5 n-3;
n-6 DPA, 22 : 5 n-6; 5-HEPE, 5-hydroxy-EPA;
5-HETE, 5-hydroxy-eicosatetraenoic acid; 12-HETE, 12-hydroxy-eicosatetraenoic acid;
5-KETE (5-oxo-ETE), 5-keto-eicosatetraenoic acid (5-oxo-eicosatetraenoic acid);
13/9-HODE, 13/9-hydroxy-octadecadienoic acid; 12,13-DiHOME,
12,13-dihydroxy-octadecenoic acid; 9,10-DiHOME, 9,10-dihydroxy-octadecenoic acid. *
Significant difference (P<0·05) between feed groups (Welch’s
two-sample t test).

