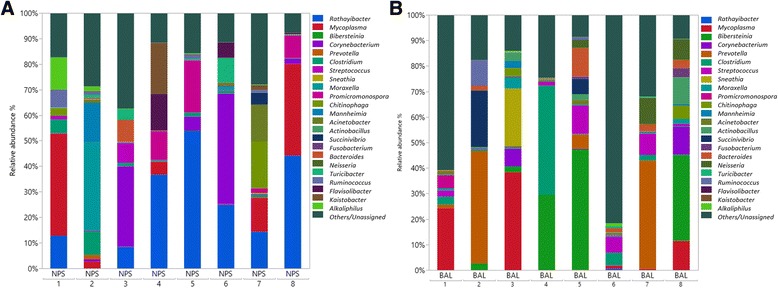
Fig. 2.

Relative abundance of bacterial 16S rRNA gene sequences at the genus level observed in the NPS a and BAL b samples from 8 healthy feedlot calves. Only those bacterial genera that averaged more than 1% of the relative abundance across all samples when sequencing V3-V4 hypervariable regions are displayed. All other unassigned and classified OTUs belonged to genera comprising less than 1% of the total abundance represented as others/Unassigned
