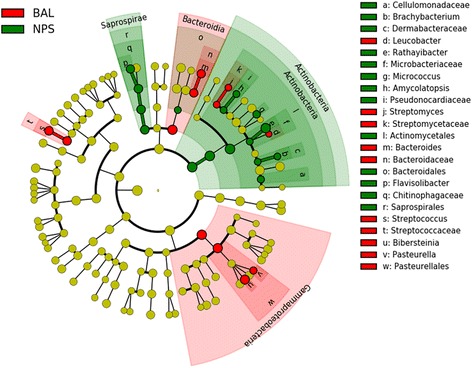
Fig. 3.

Cladogram displaying the 23 operational taxonomic units (OTUs) with significantly different abundance between the nasopharyngeal (NPS) and bronchoalveolar lavage (BAL) samples with an absolute Linear Discriminant Analysis LDA score log10 ≥ 2.0. Differences are represented in the color of the most abundant class (red indicating BAL, Green indicating NPS). Each circle’s diameter is proportional to the taxon’s relative abundance. Green: NPS; Red: BAL
