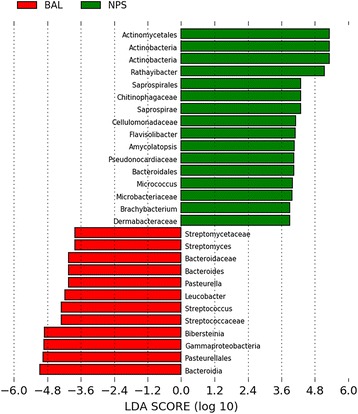
Fig. 4.

LEfSe comparison results of nasopharyngeal (NPS) and bronchoalveolar lavage (BAL) microbiota in clinically healthy calves depicting the top operational taxonomic units (OTUs) with the highest linear discriminant analysis LDA score log10 ≥ 2.0. These graphical outputs were generated by the publicly available LEfSe visualization modules. LEfSe scores can be interpreted as the degree of consistent difference in relative abundance between features in the two classes of analyzed microbial communities. Green: NPS; Red: BAL
