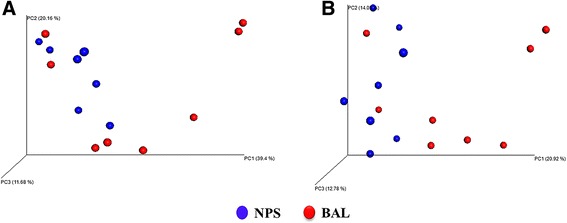
Fig. 5.

Principal coordinate analysis (PCoA) of the weighted UniFrac distances a and un-weighted UniFrac distances b for the nasopharyngeal (NPS) and bronchoalveolar lavage (BAL) samples in clinically healthy feedlot calves. The percent variation explained by each principal coordinate is indicated on the axes. The individual data points from NPS (blue circle) and BAL (red circle) which represent total airway microbiota compositions of each calf are also depicted
