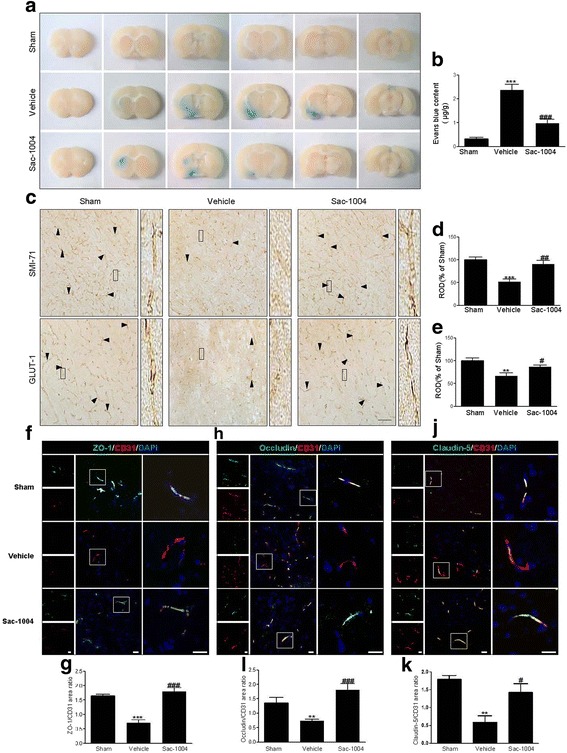
Fig. 5.

Sac-1004 blocks BBB disruption after I/R.Evans Blue dye extravasation (a) in the sham, vehicle-ischemia, and Sac-1004-ischemia groups 3 h after I/R. In the Sac-1004-ischemia group, the amount of Evans Blue dye extravasation was significantly decreased in the ischemic brain compared with that in the vehicle-ischemia group. b The quantitative analysis of Evans Blue leakage 3 h after I/R (n = 7 per group; *** P < 0.001 vs sham group, ### P < 0.001 vs vehicle-ischemia group). SMI-71 and GLUT-1 immunohistochemistry (c) in the ischemic cortex of the sham, vehicle-ischemia, and Sac-1004-ischemia groups 3 h after I/R. In the sham group, SMI-71 and GLUT-1 immunoreactions were easily observed in microvessels (arrowheads) in the cerebral cortex, and their immunoreactivities were significantly decreased in the vehicle-ischemia group. However, in the Sac-1004-ischemia group, SMI-71 and GLUT-1 immunoreactivities were significantly higher than those in the vehicle-ischemia group. Rectangle: the region enlarged in high-power images. Scale bar = 60 μm. d and e ROD as percentage values of SMI-71 and GLUT-1 immunoreactivities in the ischemic cortex 3 h after I/R (n = 7 per group; ** P < 0.01 and *** P < 0.001 vs sham group, # P < 0.05 and ## P < 0.01 vs vehicle-ischemia group). f Immunofluorescence staining for ZO-1 (green) and CD31 (red) in the ischemic cortex of the sham, vehicle-ischemia, and Sac-1004-ischemia groups 3 h after I/R. Merged images of ZO-1 and CD31 staining are also shown. Square: the region enlarged in high-power images. Scale bar = 20 μm. g Quantitative assessment of ZO-1 positive blood vessels. h Immunofluorescence staining for occludin (green) and CD31 (red) in the brain sections. Merged images of occludin and CD31 staining are also shown. Square: the region enlarged in high-power images. Scale bar = 20 μm. i Quantitative assessment of occludin positive blood vessels (n = 5 per group; *** P < 0.001 vs sham group, ### P < 0.001 vs vehicle-ischemia group). j Immunofluorescence staining for Claudin-5 (green) and CD31 (red) in the brain sections. Merged images of claudin-5 and CD31 staining are also shown. Square: the region enlarged in high-power images. Scale bar = 20 μm. (k) Quantitative assessment of claudin-5 positive blood vessels (n = 5 per group; ** P < 0.01 vs sham group, # P < 0.05 vs vehicle-ischemia group). The bars indicate the means ± SEM
