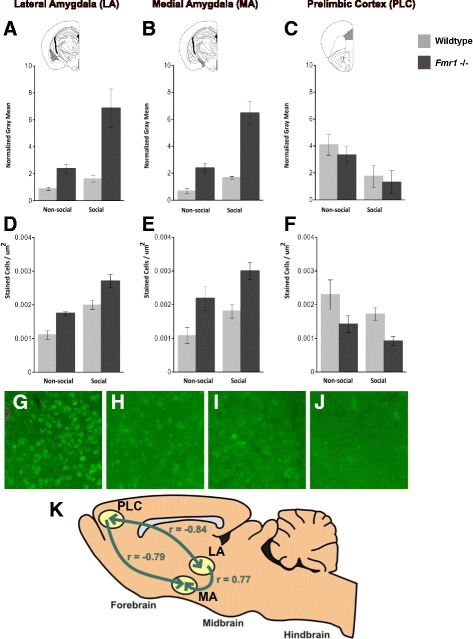
Fig. 3.

c-Fos staining in Fmr1 mice. The intensity of c-Fos staining (a–c) and the number of c-Fos-positive cells (d–f) in the lateral amygdala (a, d), medial amygdala (b, e), and prelimbic cortex (c, f). Insets show anatomical regions assessed shaded in gray. Representative staining for c-Fos in the PLC of (g) wildtype mouse exposed to a non-social stimulus, (h) wildtype mouse exposed to a social stimulus, (l) Fmr1 KO mouse exposed to a non-social stimulus, and (j) Fmr1 KO mouse exposed to a social stimulus. The number of c-Fos-positive cells was compared between brain regions for each subject. There was a significant positive correlation between LA and MA, and a significant negative correlation between each amygdalar region and the PLC (k)
