Fig. 2.

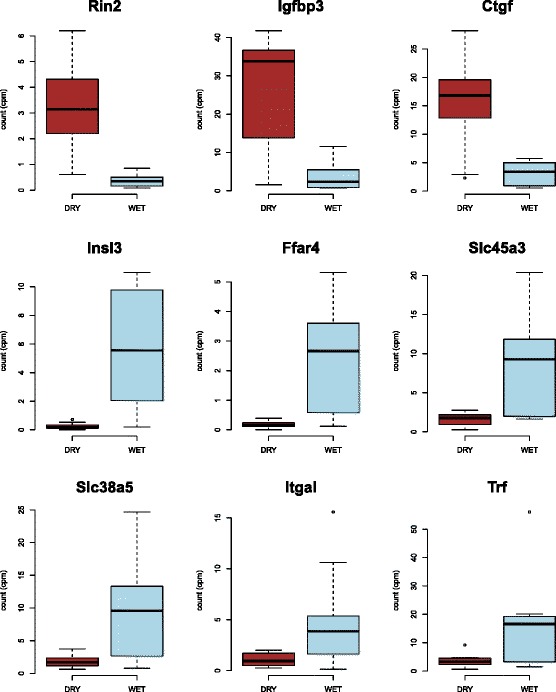
Box plots of edgeR analyzed differences in gene expression by treatment for the nine genes significantly differentially expressed in all three analyses. Counts per million (cpms) for both treatments (WET and DRY) are indicated

Box plots of edgeR analyzed differences in gene expression by treatment for the nine genes significantly differentially expressed in all three analyses. Counts per million (cpms) for both treatments (WET and DRY) are indicated