Fig. 3.

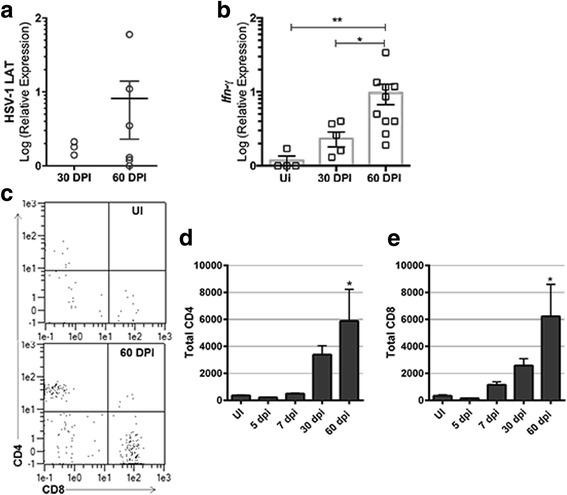
T lymphocyte numbers and Ifn-γ expression in the OB increase during latency. The OB was removed and assayed for (a LAT or (b) Ifnγ expression by RT-PCR at 30, (n = 6) or 60 (n = 10) DPI following infection of C57BL/6 mice with HSV-1 (1000 PFU/cornea). Uninfected (UI) samples served as controls. c Representative flow plots of CD4+ and CD8+ T cells (previously gated by CD45+ and CD3+) from an UI OB sample (top panel) in comparison to 60 DPI (bottom panel). *p < 0.05 comparing 30 to 60 DPI and **p < 0.005 comparing 60 DPI to UI by applying a Dunn’s multiple comparisons test following the Kruskal-Wallis multiple comparisons test. (c–e) Total CD45+, CD3+, CD4+, or CD8+ T cell counts determined by flow cytometry at the indicated time points (UI-7 DPI n = 4, 30–60 DPI, n = 5–6). (c) Representative flow plot depicting CD4+ and CD8+ T cells. *p < 0.05 equating 60 DPI to UI (d, e) also by Dunn’s multiple comparisons post-test
