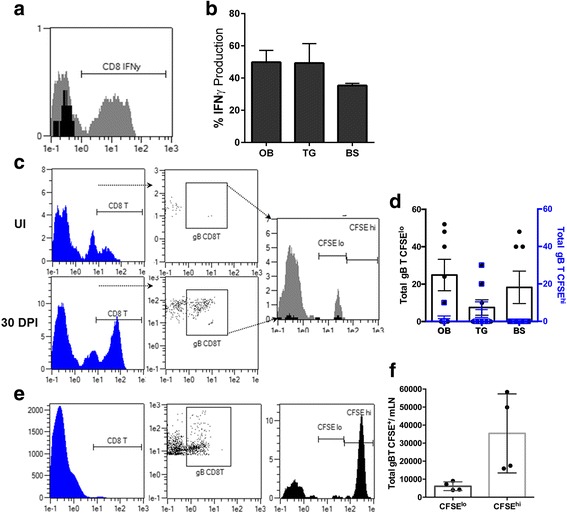
Fig. 5.

OB T cells exhibit effector function by production of IFN-γ. a Histogram representing isolated OB T cells at 30 DPI stimulated with PMA and ionomycin (grey) compared to uninfected (black). b Percentage of isolated CD8+ T cells expressing intracellular IFN-γ (OB n = 6, TG and BS, n = 4). c Representation of adoptively transferred HSV-1-specific CD8+ T cells gated on CD8+ and HSV-1-specific gB-tetramer+ and further identified by intracellular fluorescent levels of CFSE from a 30 DPI OB sample (grey) compared to UI recipient mouse (black). d Total number of CFSElo- or CFSEhi-labeled HSV-1 gB-specific T cells from the OB, TG, or BS at 30 DPI (n = 7–8). e Representative plots from adoptively transferred CFSE+ gB-specific CD8+ T cells within the mandibular LN’s (mLN) at 30 DPI (n = 4). f Total number of CFSE+ gB-specific CD8+ T cells within the mandibular LN at 30 DPI
