
Fig. 1.
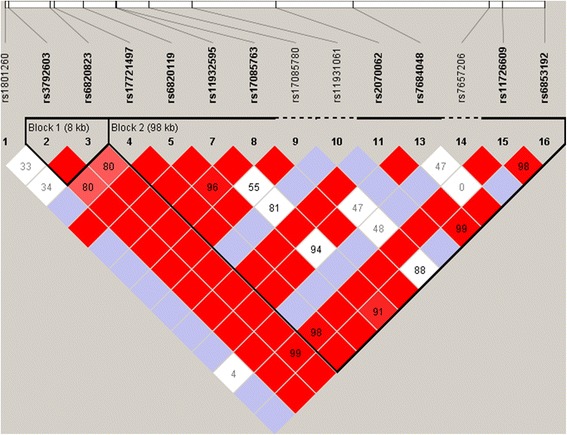
Linkage disequilibrium (LD) plot across the CLOCK gene: The horizontal white bar depicts the 117-kb DNA segment of chromosome 4q12 analyzed in the sample. In the LD plot each diamond represents the magnitude of LD for a single pair of markers. Black indicates strong LD (r2 = 1.0); white indicates no LD (r2 = 0); and the gray tones indicate intermediate LD. The numbers inside the diamonds stand for r2values