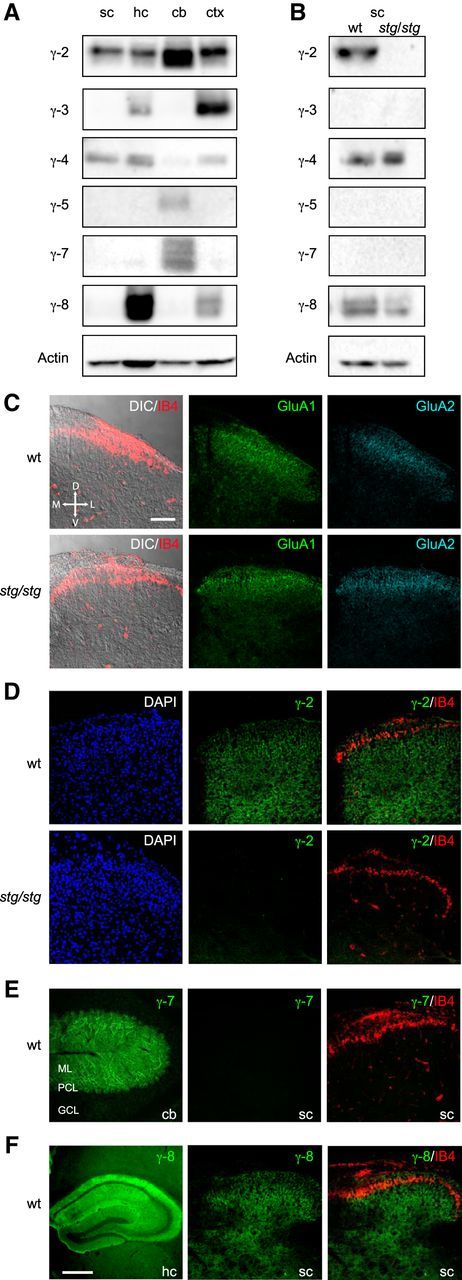
Figure 1.

TARP expression in the spinal cord. A, Immunoblots comparing tissue expression of γ-2, γ-3, γ-4, γ-5, γ-7, and γ-8 in homogenates of spinal cord (sc), hippocampus (hc), cerebellum (cb), and cortex (ctx). Note the presence of γ-2 and γ-4 in spinal cord. B, Immunoblots comparing wt and stg/stg spinal cord. Note the expected absence of γ-2. Increased exposure times (compared with A) were used for γ-3, γ-5, γ-7, and γ-8 and revealed the presence of γ-8 in both wt and stg/stg samples. The approximate molecular weights of the various TARPs (in kDa) were as follows: γ-2, 35; γ-3, 32; γ-4, 45; γ-5, 27; γ-7, 28; γ-8, 47. Actin (41 kDa) served as a loading control. C–F, Confocal images (maximum intensity projections) of representative tissue sections immunolabeled for TARPs and AMPARs. C, Dorsal horn of the spinal cord. Left, differential interference contrast images overlaid with fluorescence signal for the lamina II-specific marker IB4 (red). Middle and right panels, Similar pattern of expression for AMPAR subunits GluA1 (green) and GluA2 (cyan) in sections from wt and stg/stg mice. Here, and in following panels, all spinal cord images are transverse and shown in the same orientation. D, Dorsal; V, ventral; M, medial; L, lateral. Scale bar, 100 μm. D, Comparison of γ-2 expression in the dorsal horn of wt and stg/stg mice. Left, DAPI staining (blue). Middle, γ-2 (green). Right, Overlay of IB4 (red) and γ-2 (green). E, Left, γ-7 expression (green) in cerebellum (cb); molecular layer (ML), Purkinje cell layer (PCL), and granule cell layer (GCL). Middle, γ-7 (green) in spinal cord. Right, Overlay of IB4 (red) and γ-7 (green). F, Left, γ-8 (green) in hippocampus (hc). Scale bar, 500 μm. Middle, γ-8 (green) in dorsal horn. Right, Overlay of IB4 (red) and γ-8 (green).
