Figure 3.

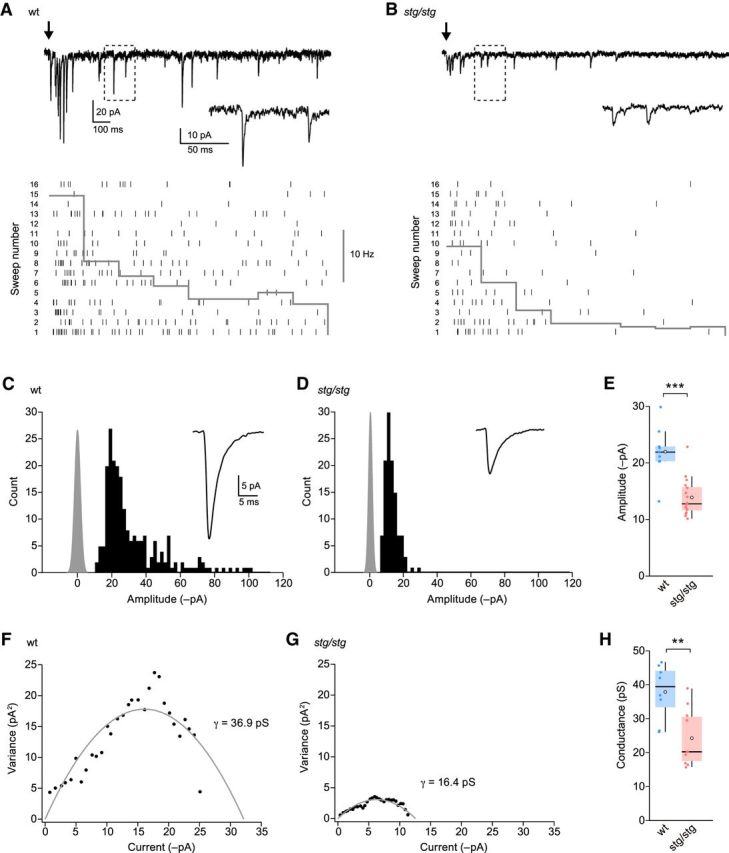
Evoked qEPSCs in lamina II neurons from wt and stg/stg mice. A, Representative recording from a wt mouse of electrically evoked qEPSCs in the presence of SrCl2 (−60 mV). Black arrow indicates the time of stimulation. Inset, Expansion of indicated area. Bottom, Raster plot showing individual qEPSCs (vertical ticks) over 16 stimulation trials. Overlaid histogram shows the frequency of events within 200 ms bins averaged over the 16 trials. B, Same as A, but for a neuron from an stg/stg mouse. C, Histogram of qEPSC amplitudes (same cell as A). Gray represents background noise. Inset, Average mEPSC waveform. D, Same as C, but for the stg/stg neuron in B. E, Summary data for qEPSC amplitudes. F, Current-variance relationship for the same cell as A. The weighted mean conductance (γ) was determined from the parabolic fit (gray) of the data. G, Same as F, but for the stg/stg neuron in B. H, Summary data for estimated single-channel conductance. Box-and-whisker plots as in Figure 2. **p < 0.01. ***p < 0.001.
