Figure 4.
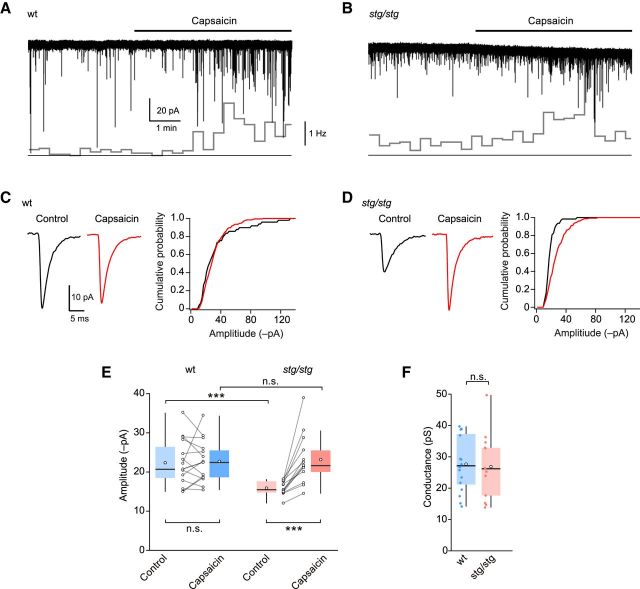
Basal, but not capsaicin-induced, mEPSCs are reduced in lamina II neurons from stg/stg mice. A, Representative recording of mEPSCs from a lamina II neuron of a wt mouse showing the effect of bath-applied capsaicin (0.1 μm). Inset (bottom), Changes in mEPSC frequency (20 s bins). B, Same as A, but for a neuron from an stg/stg mouse. C, Average mEPSC waveforms from the recording in A, together with cumulative probability plots for the amplitudes of control and capsaicin-induced mEPSCs. D, Same as C, but for the neuron in B. E, Summary data for mEPSC amplitudes. A two-way “split plot” ANOVA indicated no significant main effect of genotype (F(1,26) = 2.96, p = 0.098), a significant main effect of capsaicin treatment (F(1,26) = 14.73, p = 0.00071), and a significant interaction between genotype and capsaicin treatment (F(1,26) = 13.88, p = 0.00095). F, Summary data for capsaicin-induced mEPSCs showing the weighted mean single-channel conductance from psNSFA. Box-and-whisker plots as in Figure 2. ***p < 0.001.

